Balanced Cantilever Bridge
Introduction
Latest version:
![]()
balanced-cantilever-bridge-2020-10.zip
In this Tutorial, we will focus on creating the analytical model of a balanced cantilever bridge model using Rhino and Grasshopper. The bridge alignment and cross section will be defined in SOFiPLUS, and later imported into Grasshopper. The rest of the model is built entirely in Grasshopper. Here´s an overview of the workflow:
Objectives
Define the bridge alignment and superstructure cross section in SOFiPLUS
Import the bridge alignment and superstructure cross section into Grasshopper
Define important stations along the alignment called “placements”
Collect all data to build the bridge axis and create the superstructure geometric model
Define the superstructure analytical model, including the tendons
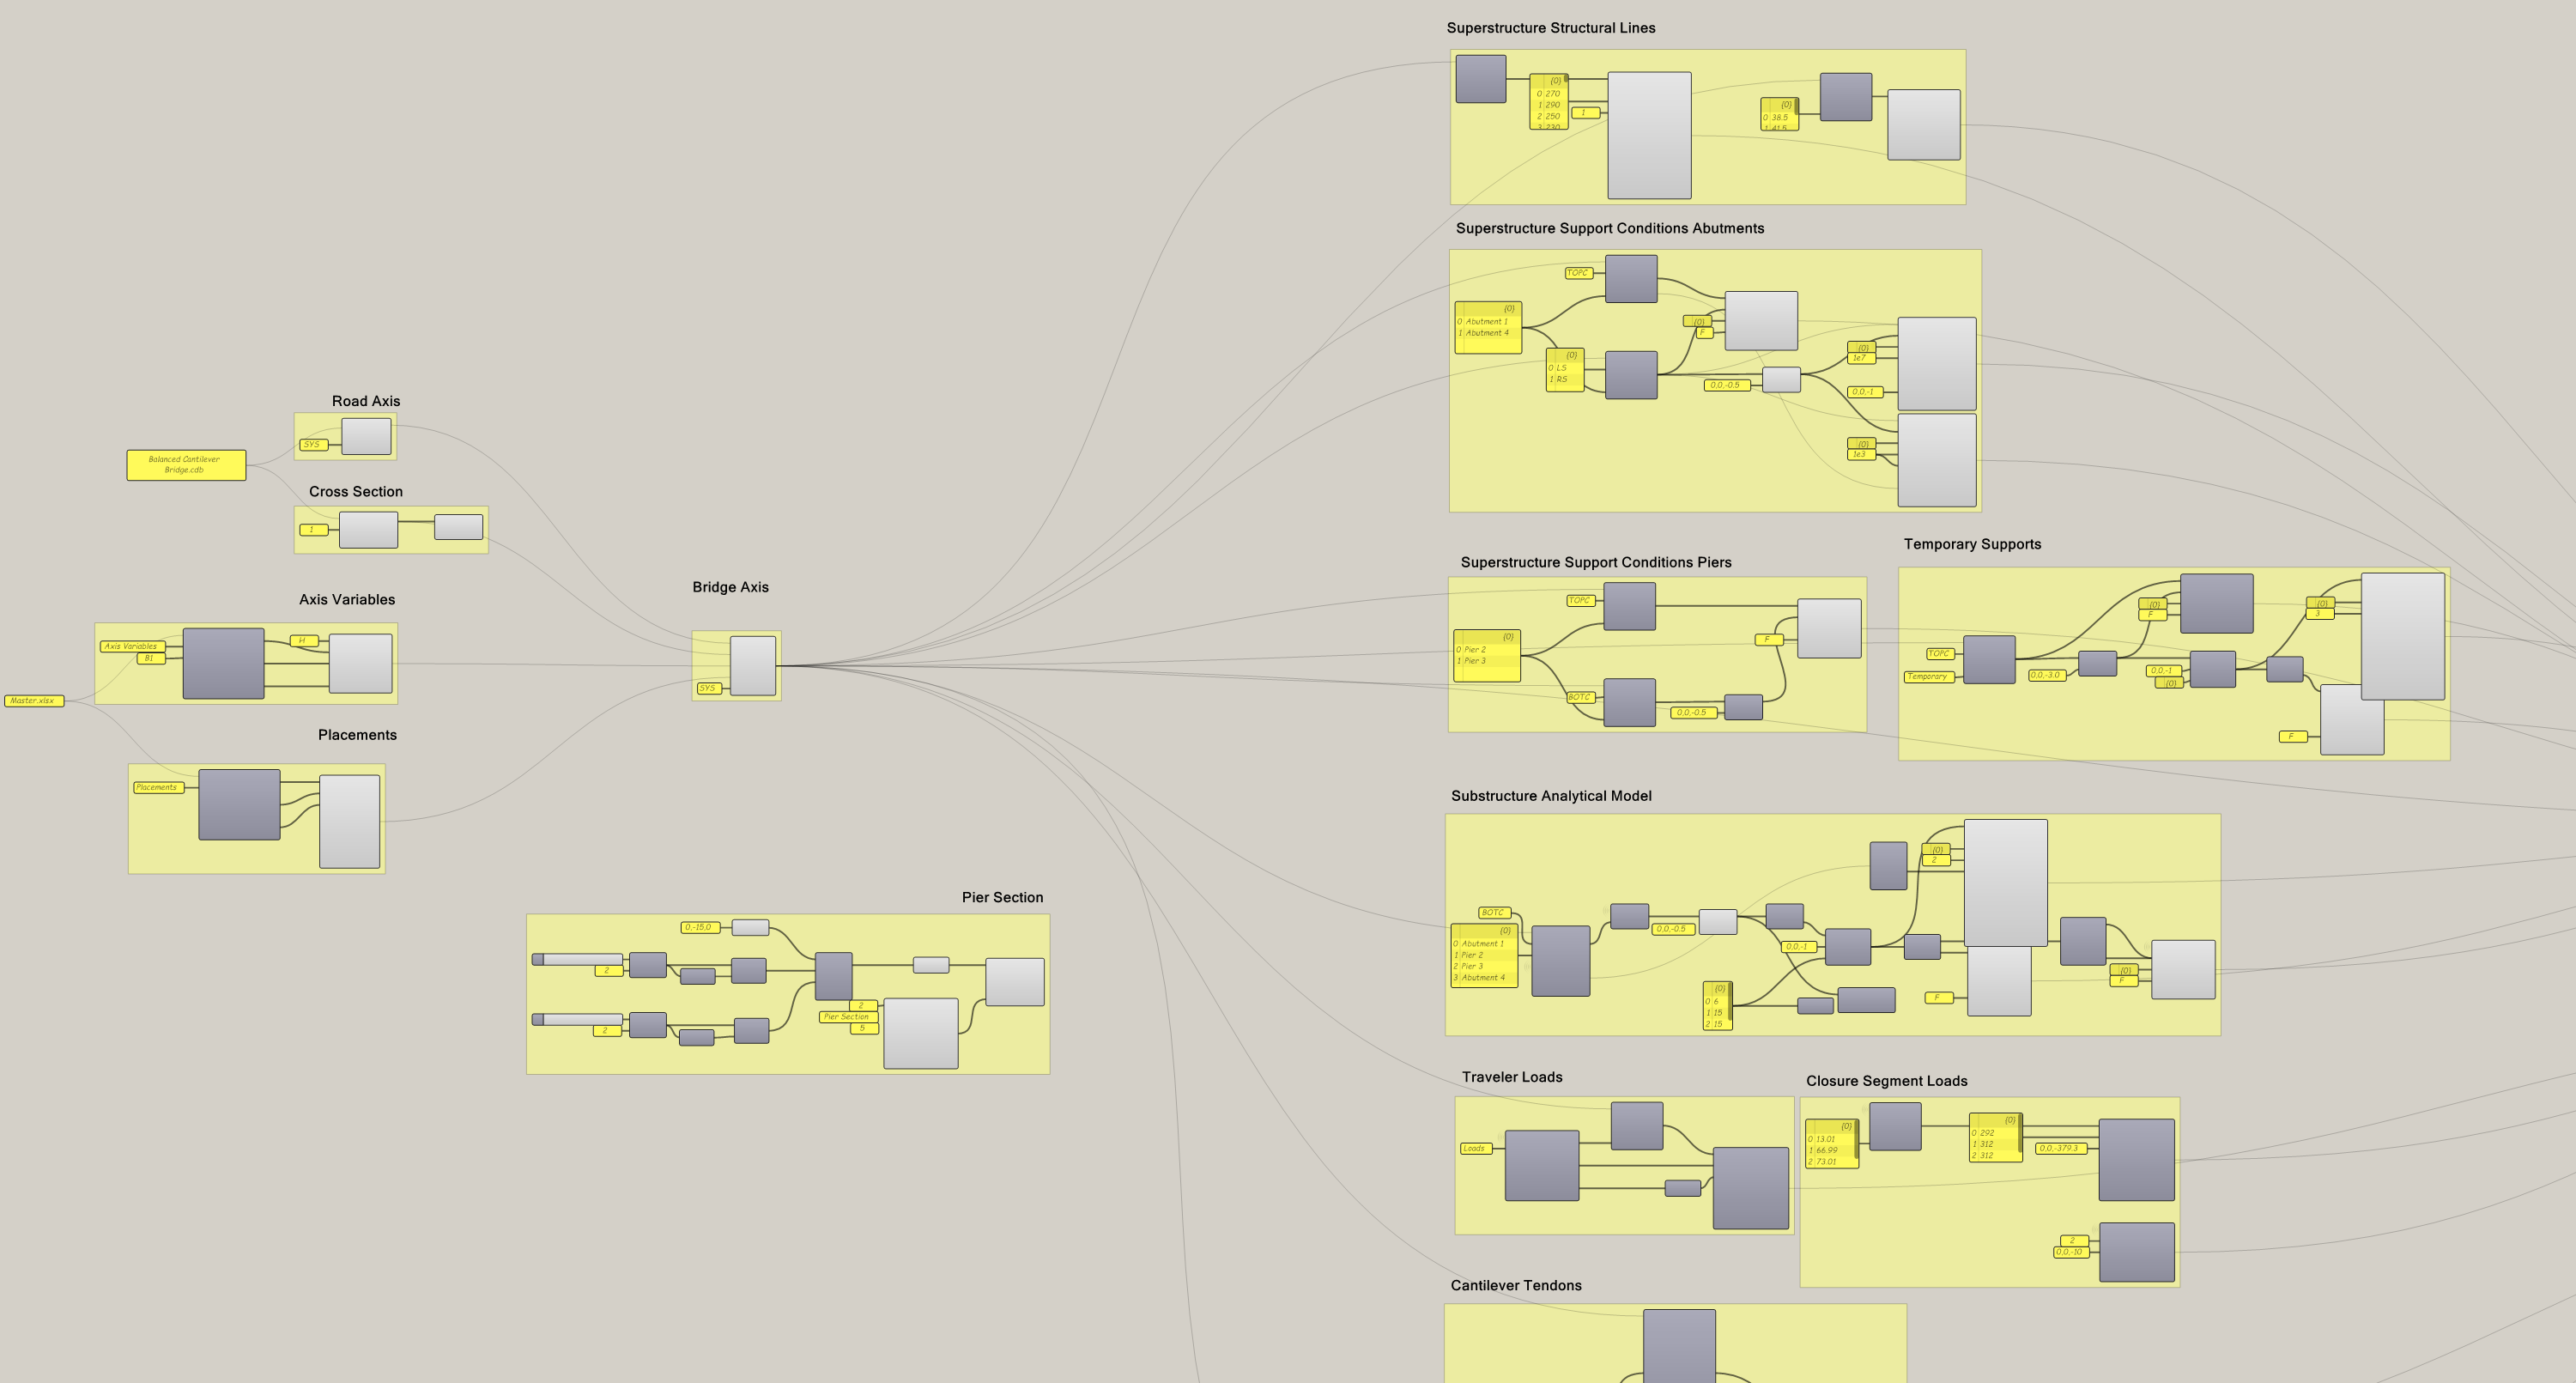
Figure 1. Part of the Grasshopper Script
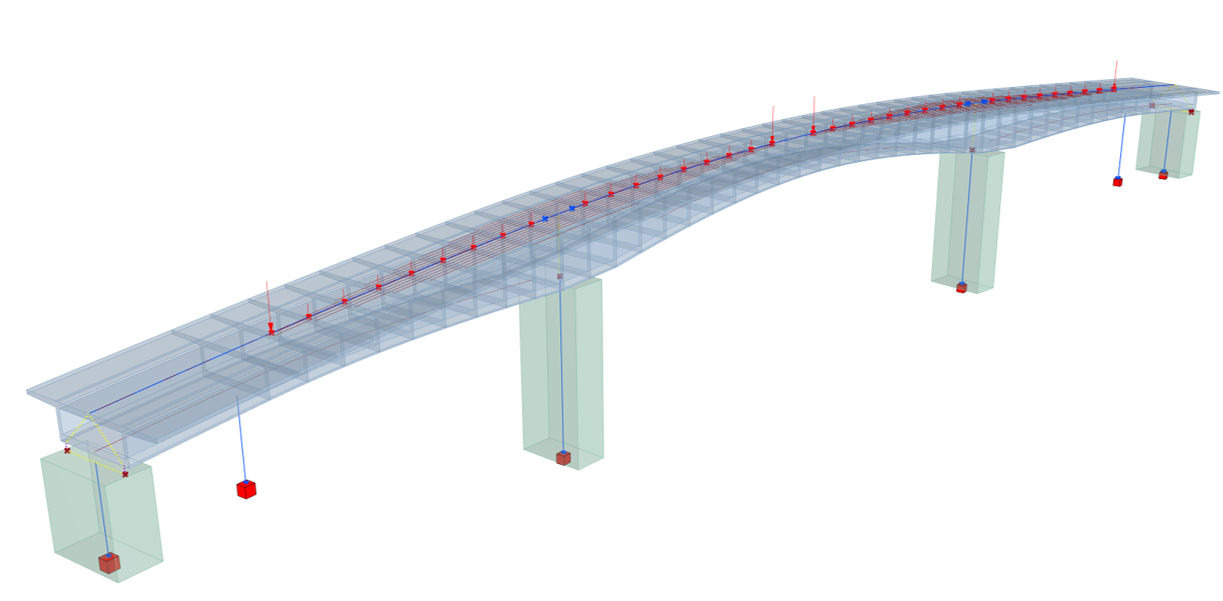
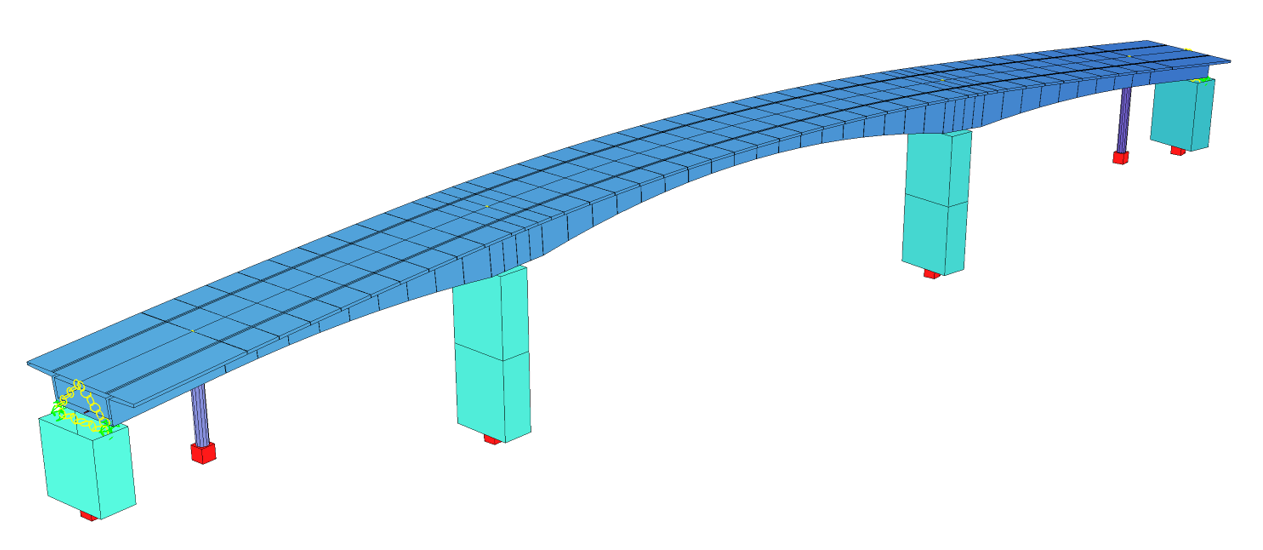
Figure 2. Geometric and Analytical Bridge Models
Define the Bridge Alignment and Superstructure Cross Section in SOFiPLUS
Open the file “Balanced Cantilever Bridge.sofistik” to go to the SOFiSTiK Structural Desktop (SSD). Open SOFiPLUS by double clicking on the “SOFiPLUS (-X) Modeling” task.
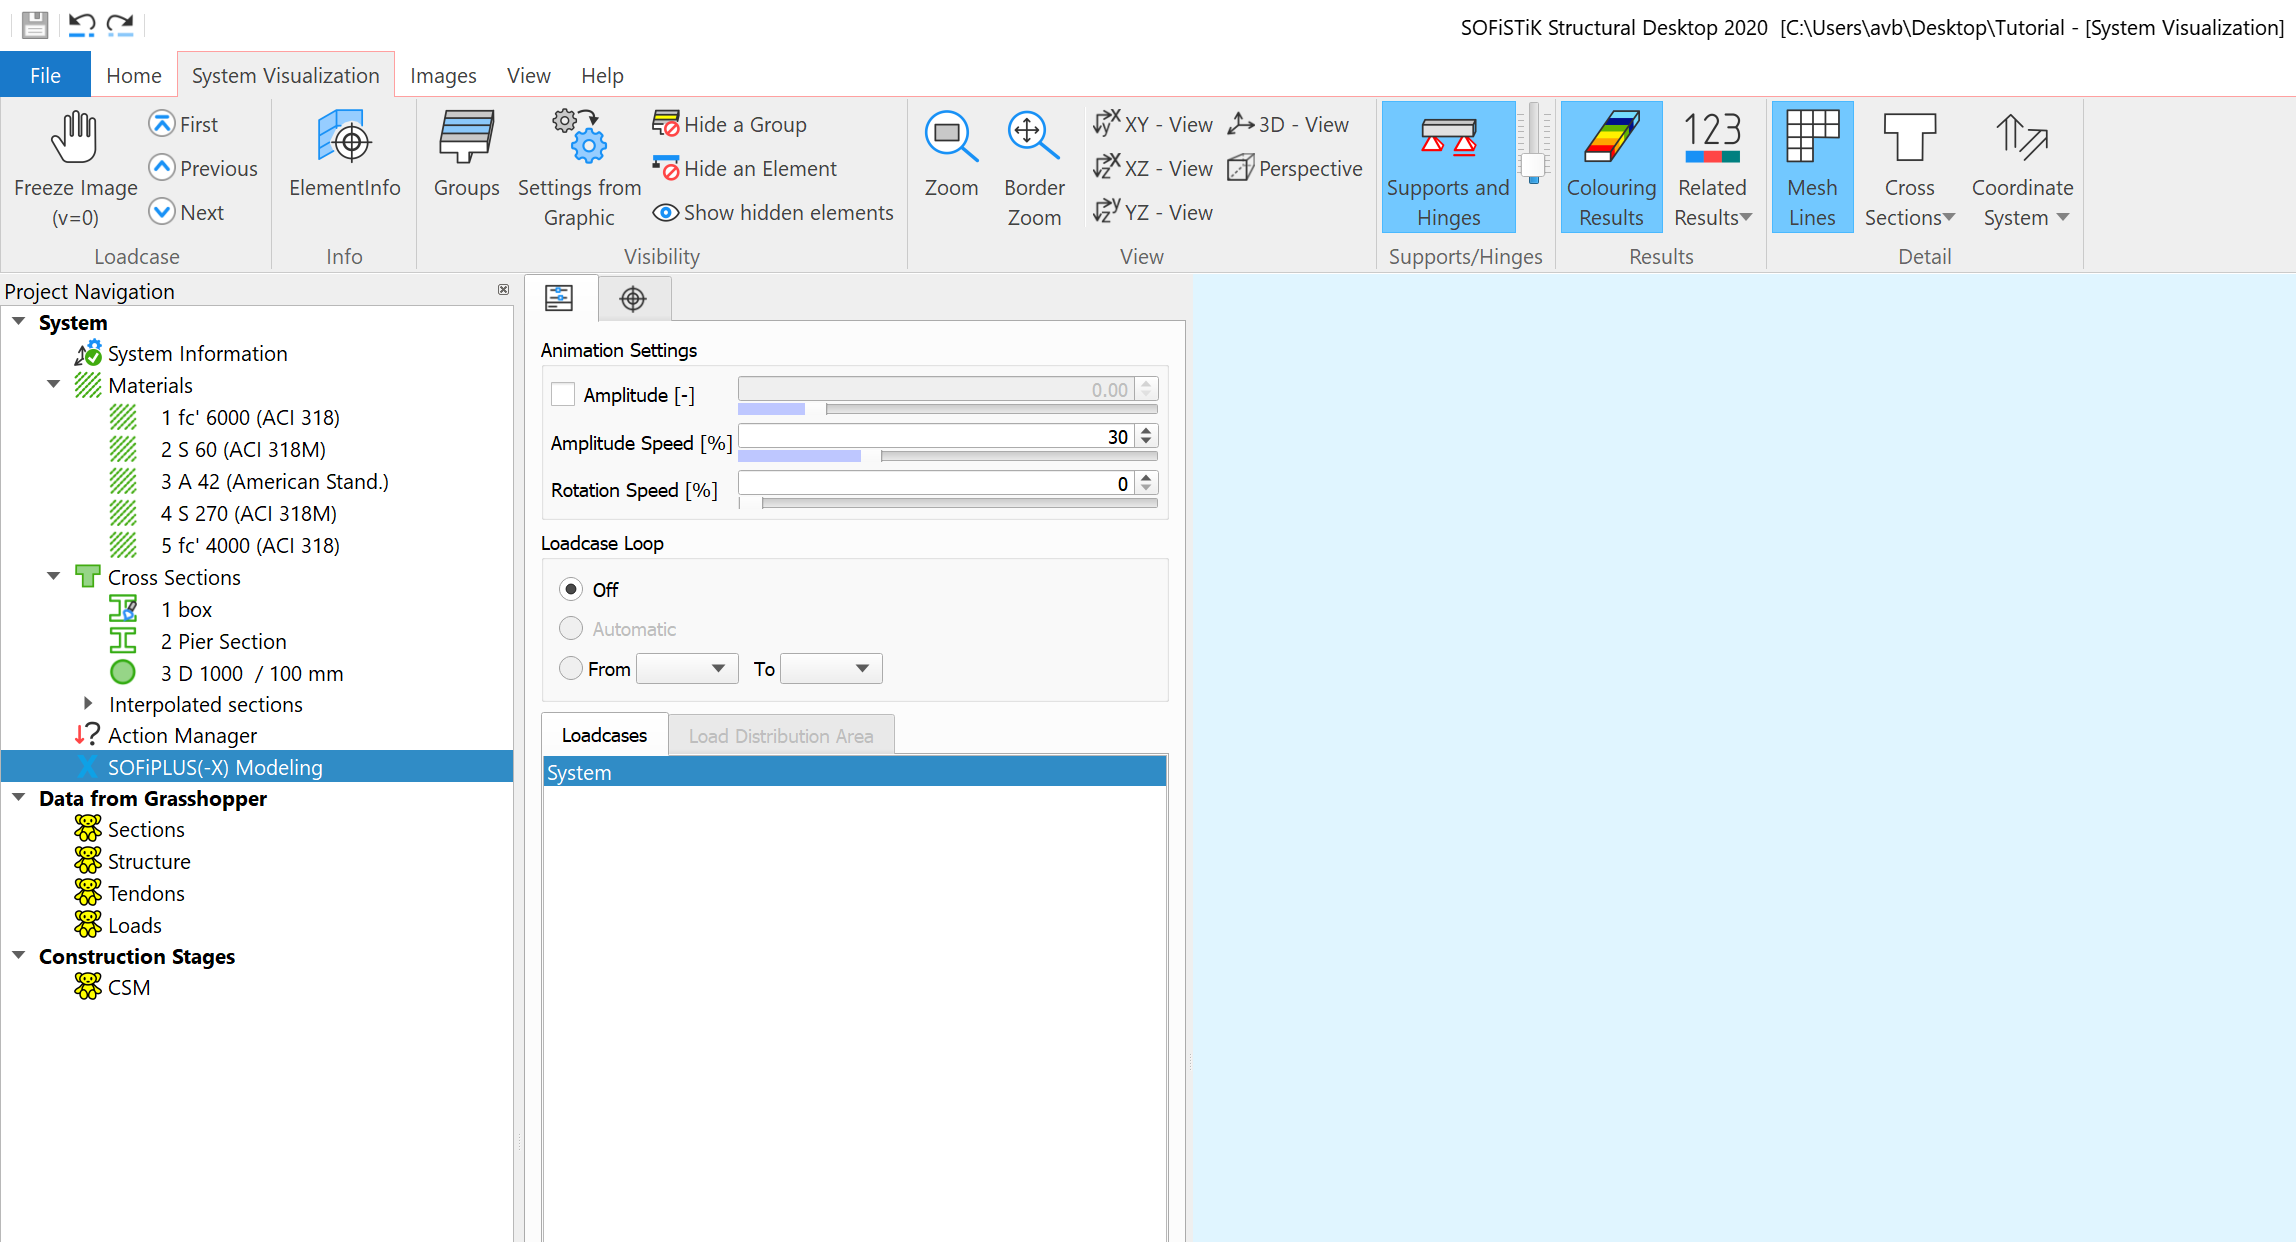
Figure 3. SSD Project
In SOFiPLUS, you can define the bridge horizontal and vertical alignment. The horizontal alignment is a simple arc with a Radius of 500m. The vertical alignment is defined by 3 points and a radius of 500m.
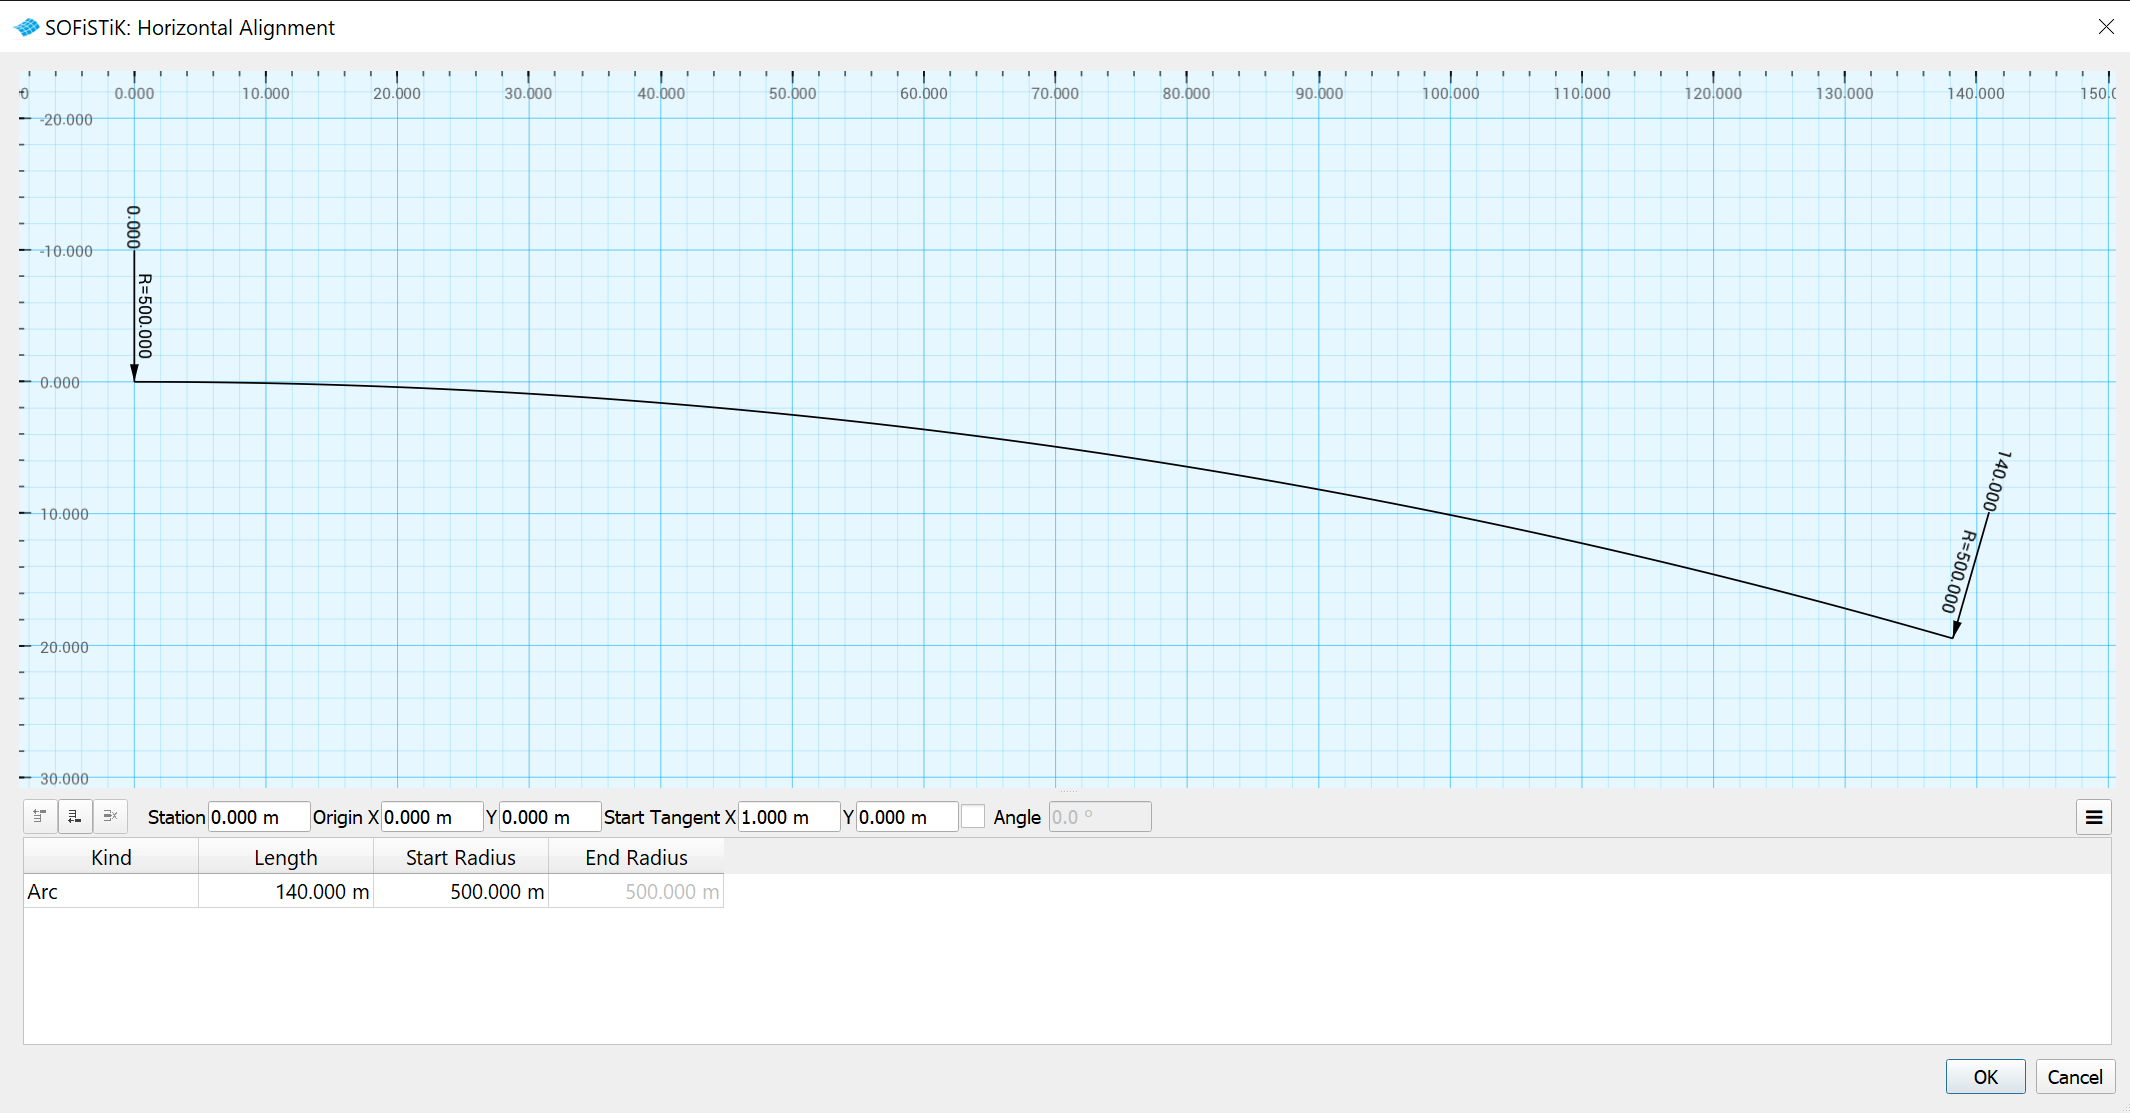
Figure 4. Horizontal Alignment
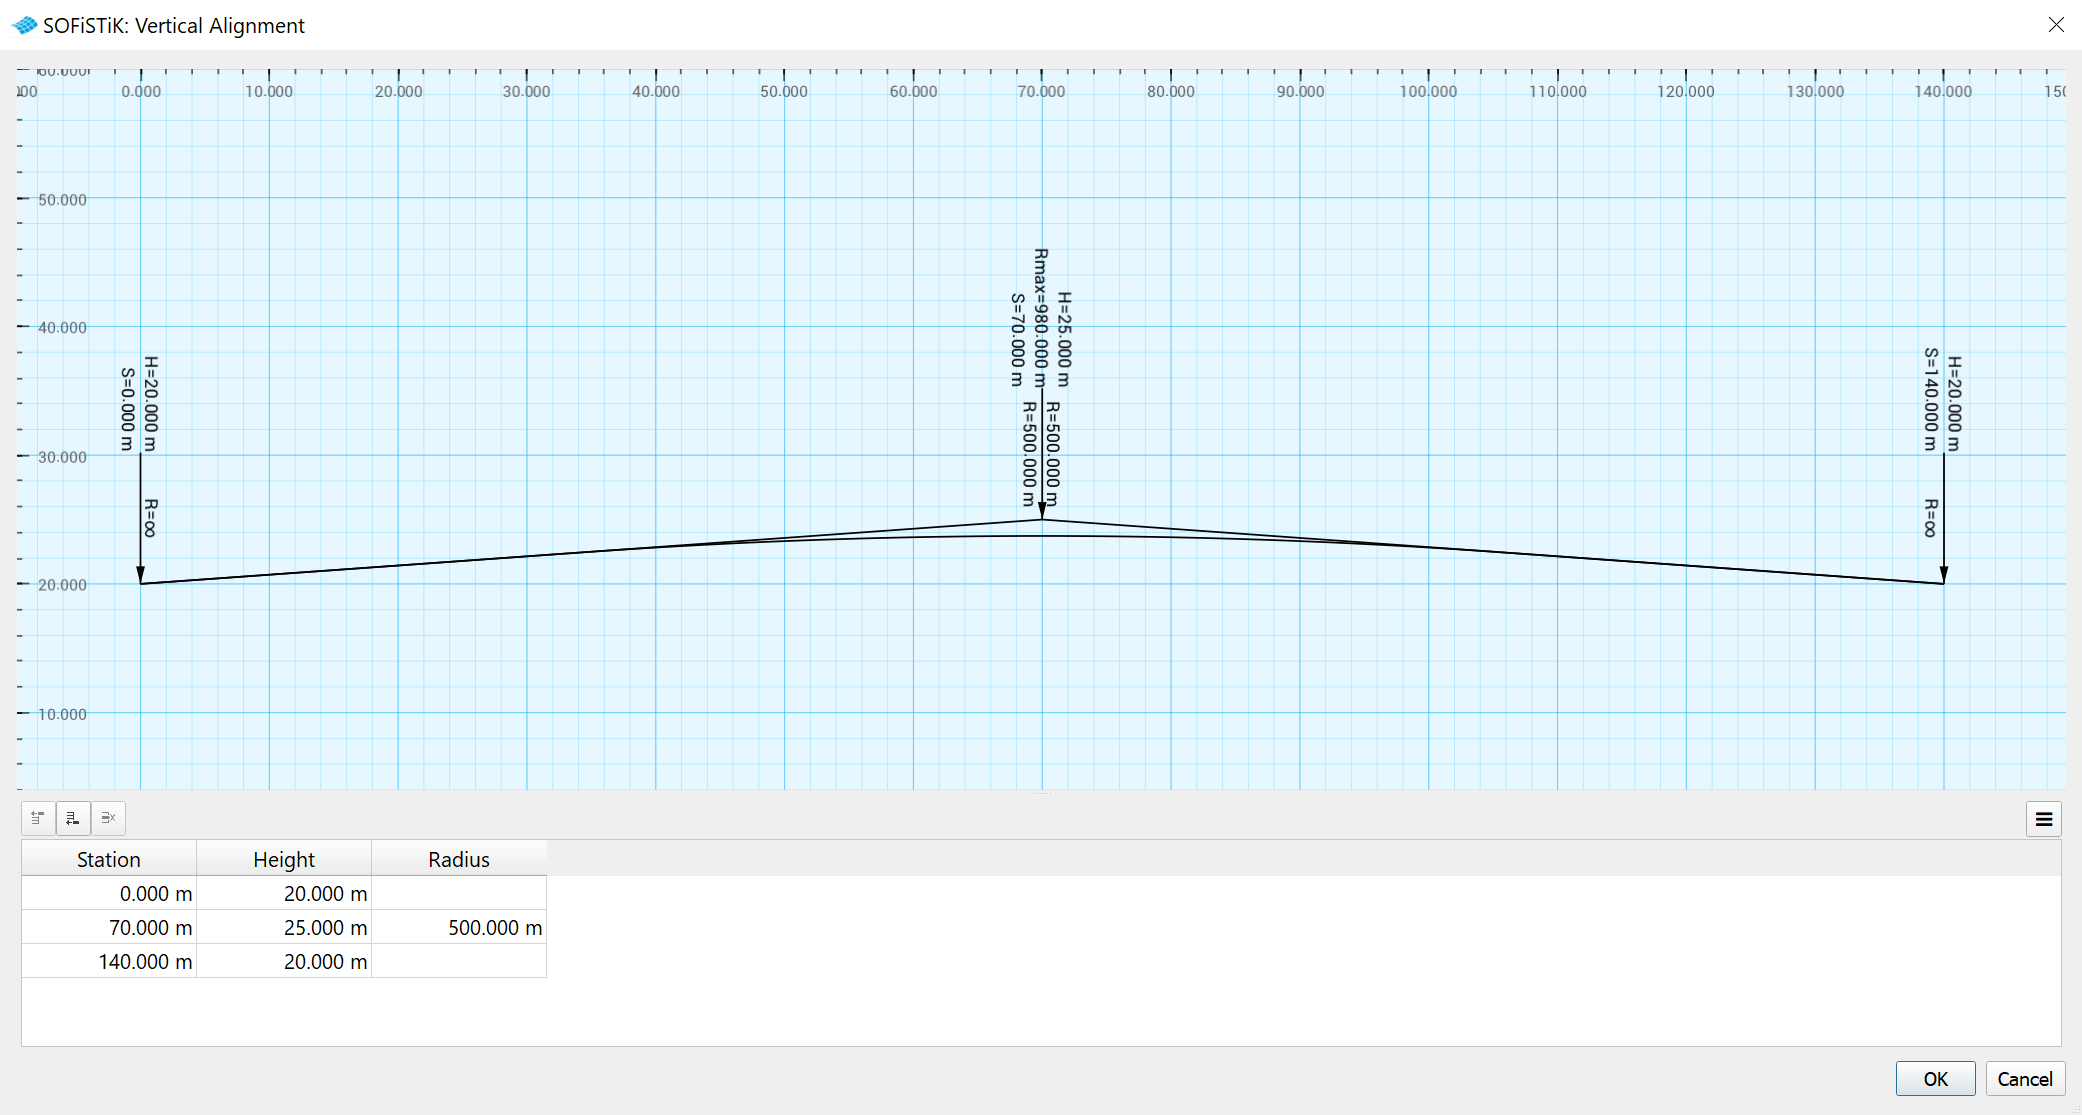
Figure 5. Vertical Alignment
The superstructure cross section is defined using the Cross Section manager in SOFiPLUS. The bottom points of the cross section have a carthesian reference to the the cross section origin. The vertical distance is described by variable #H.
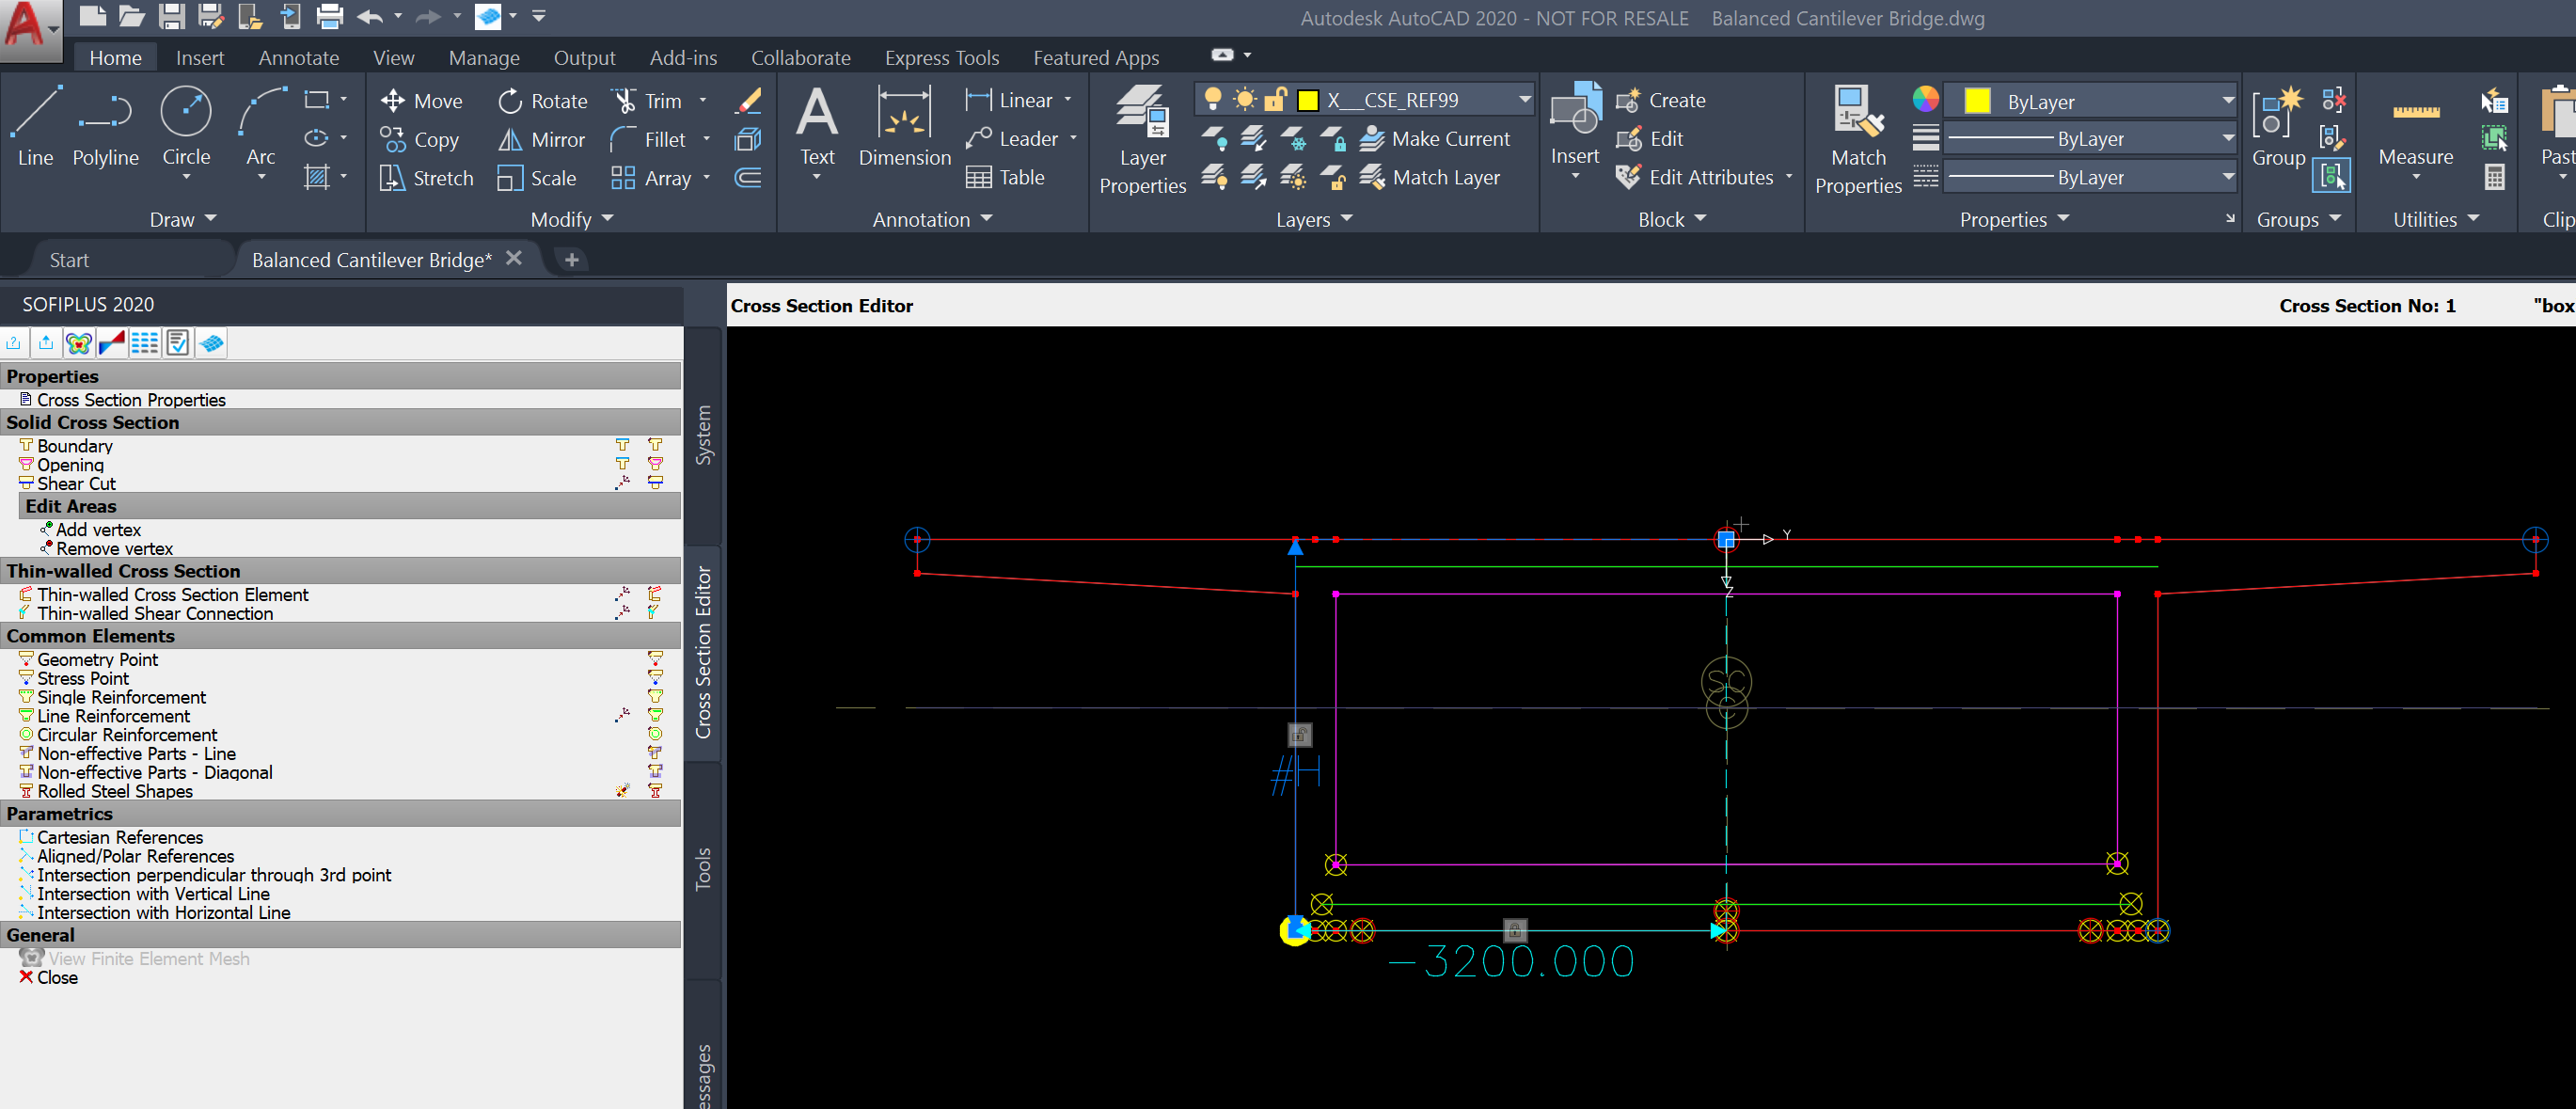
Figure 6. Cross Section definition using the Cross Section Editor
After the alignment and cross sections have been defined, the model must be exported to SSD. By doing so, the bridge alignment and superstructure cross section will be stored in the project database.
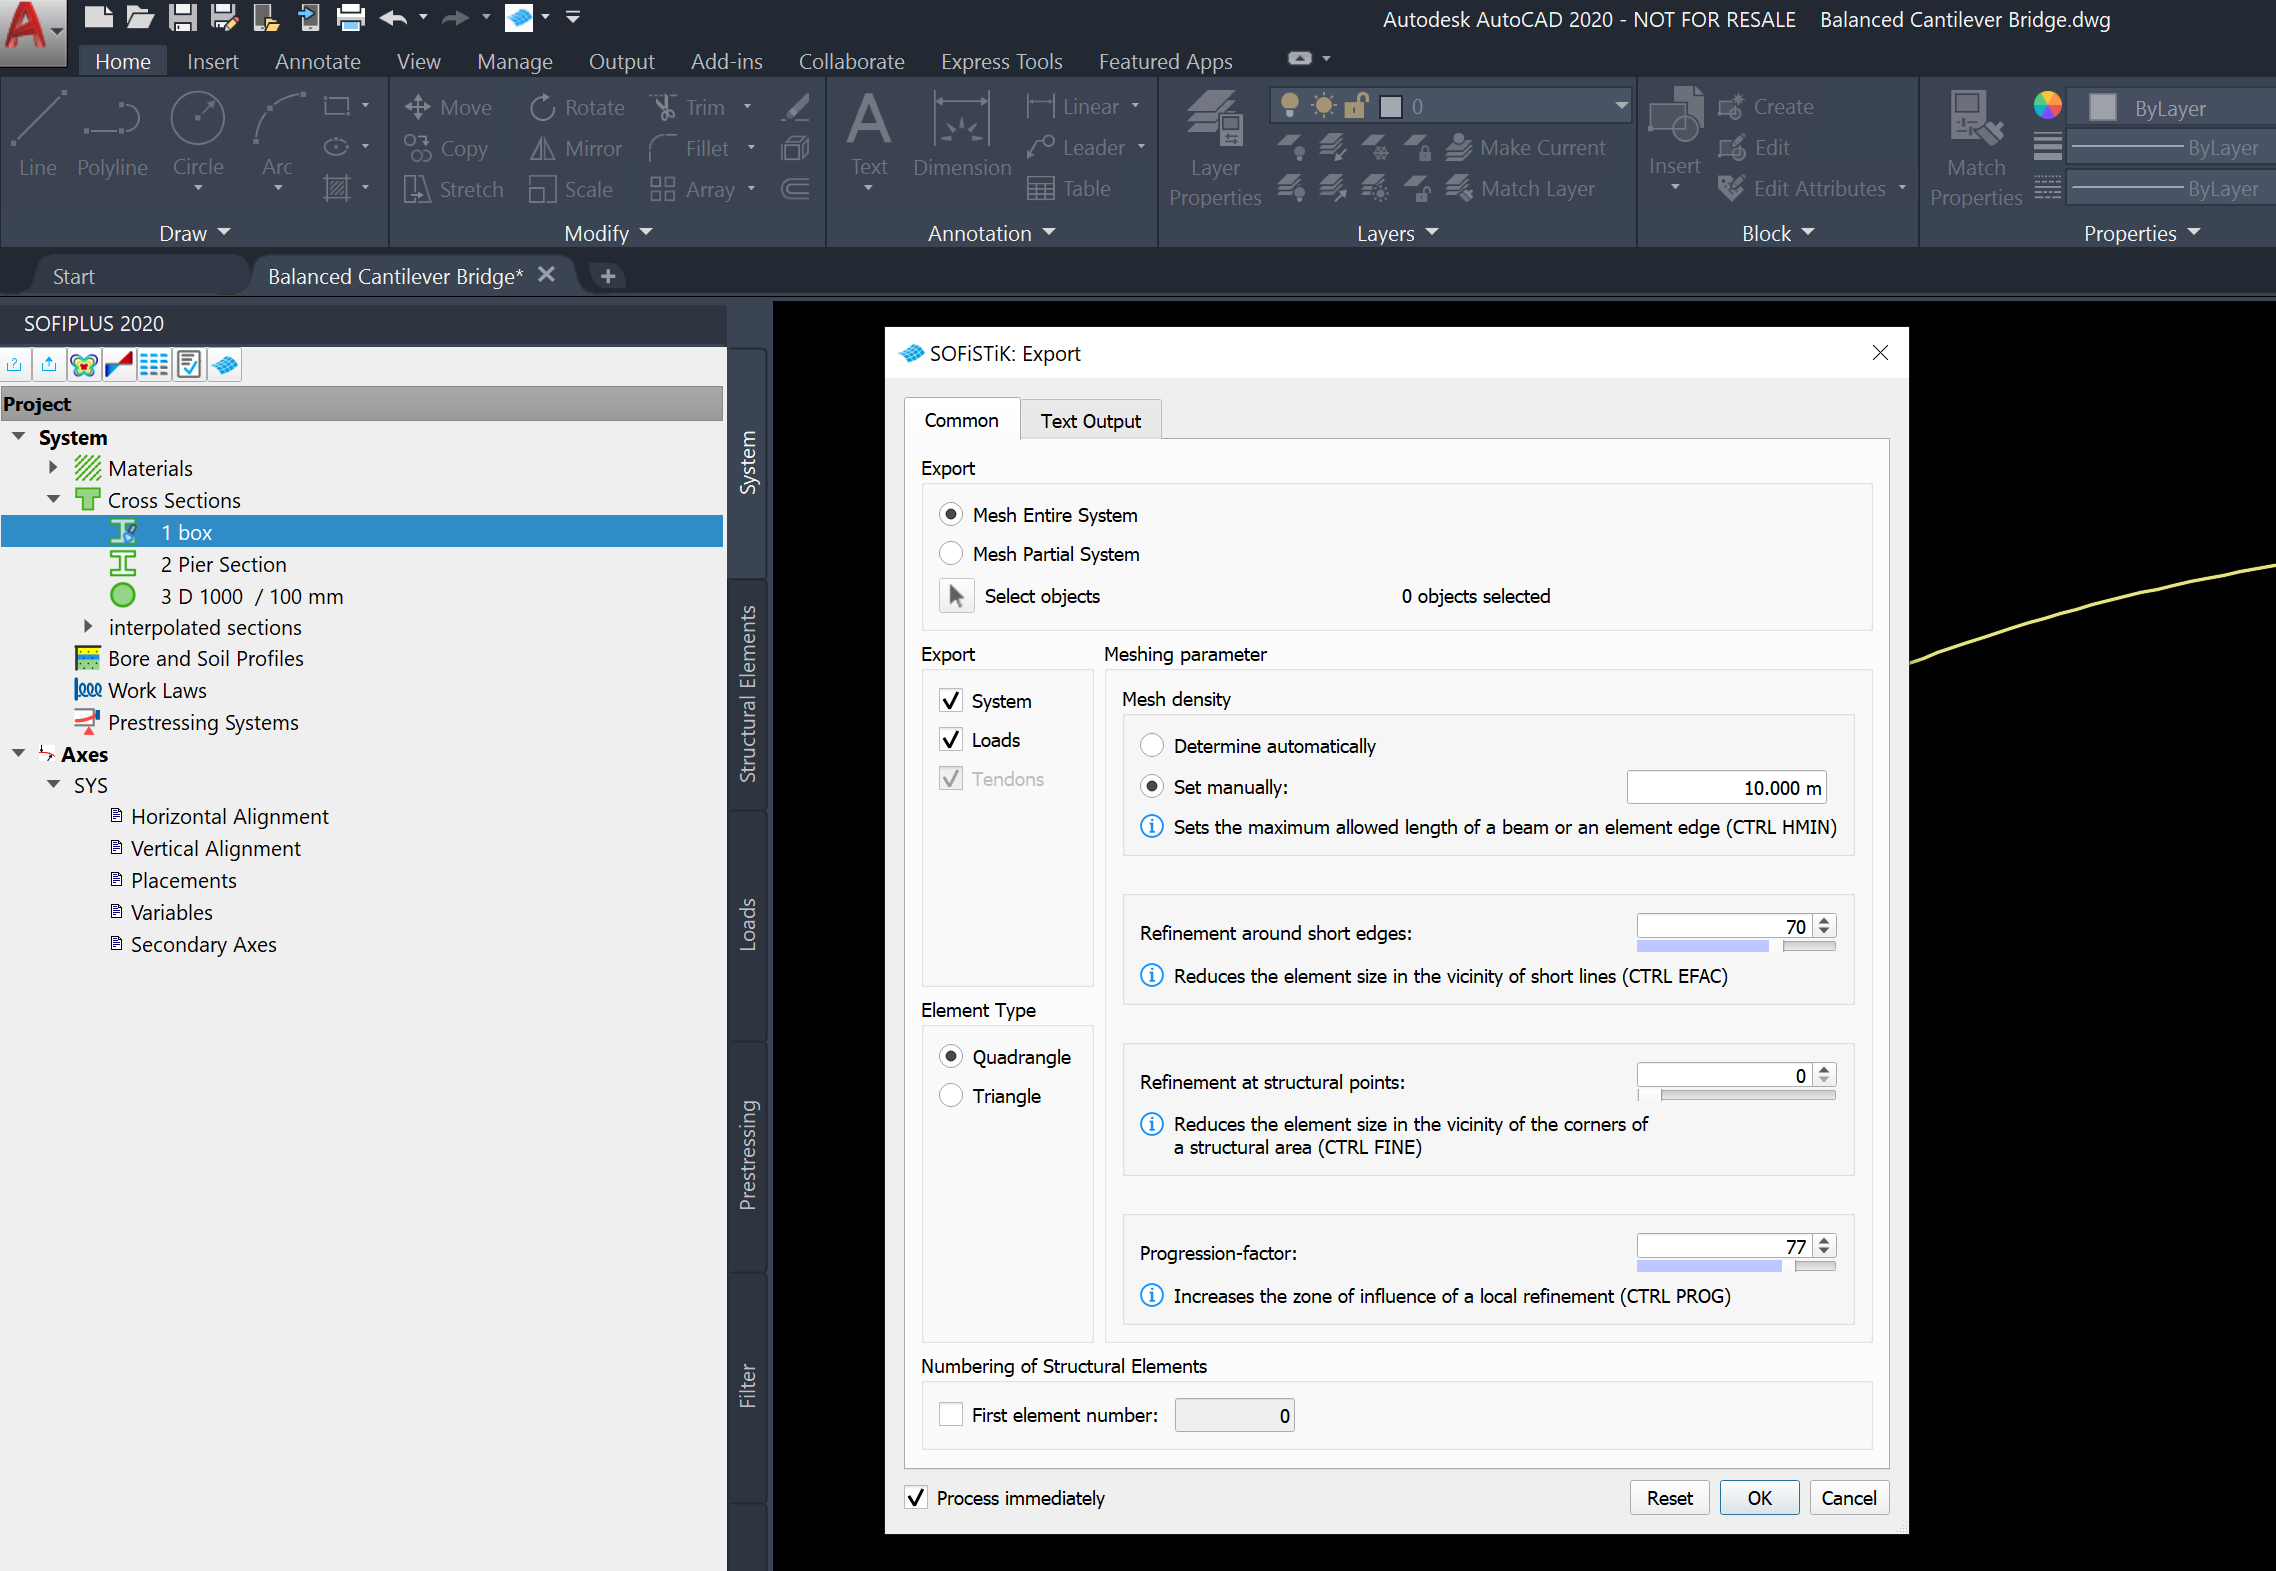
Figure 7. Export the model to SSD
Import The Bridge Alignment and Superstructure Cross Section into Grasshopper
The bridge alignment and superstructure cross section can now be imported into Grasshopper using the ReadAxisCdb and ReadSectionCdb components. The section can be visualized in Rhino using View Section.
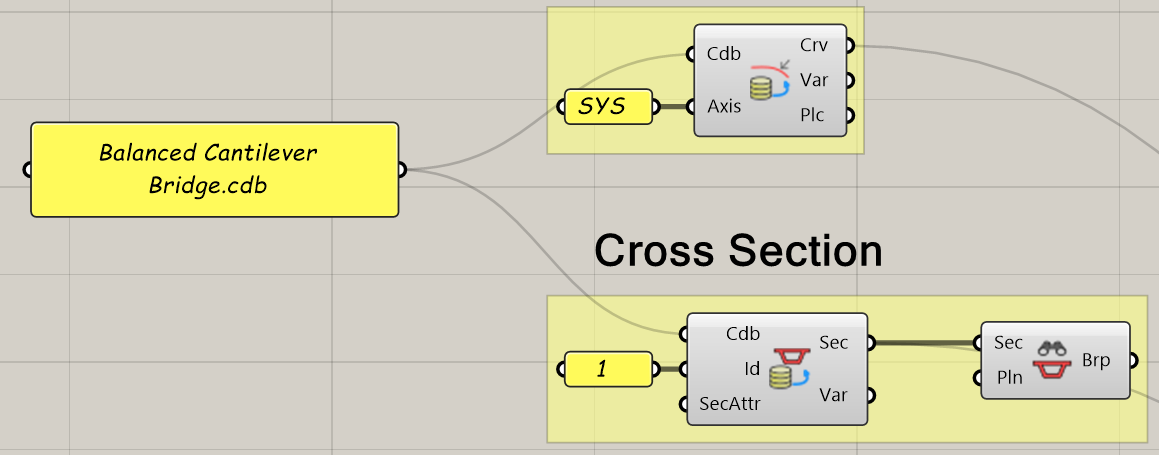
Figure 8. GH Script: Alignment and Cross Section Definition
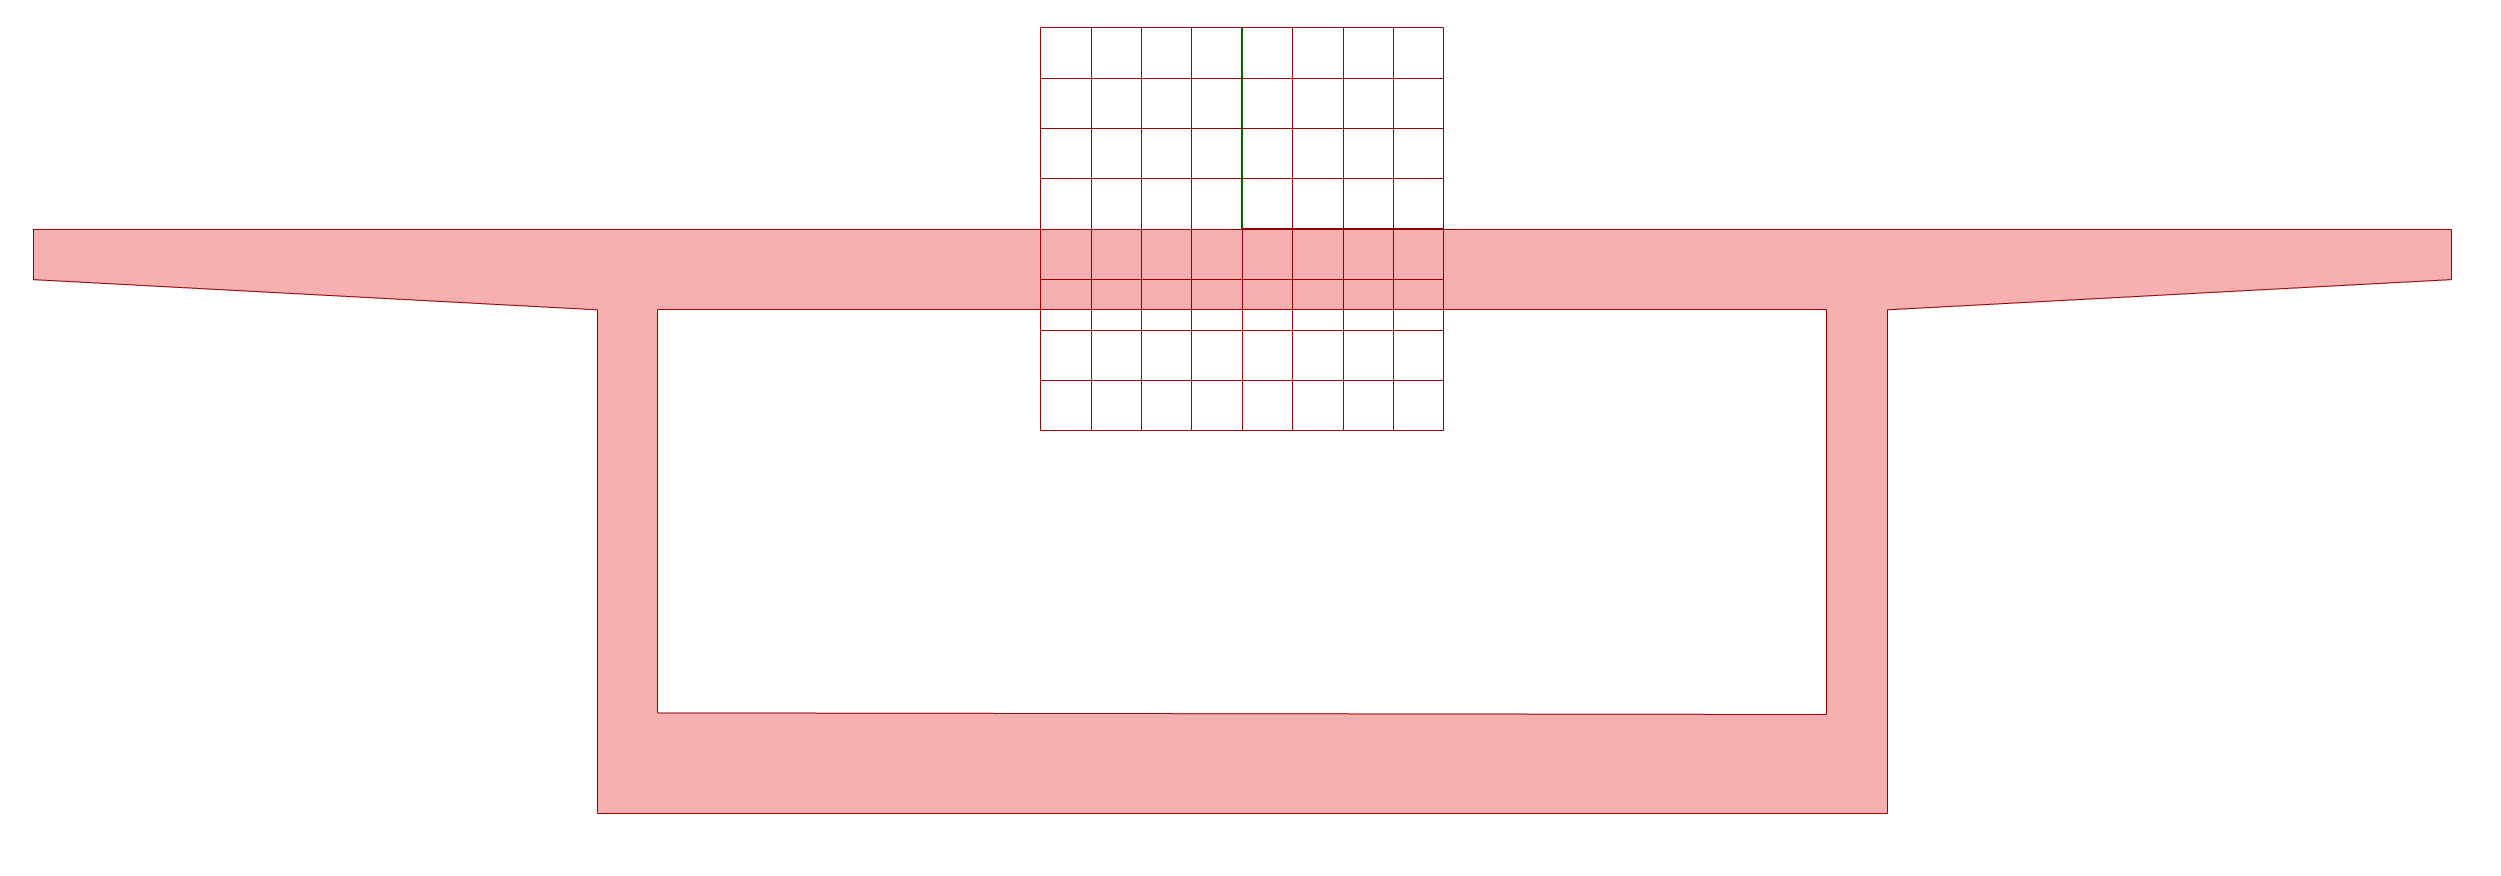
Figure 9. Cross Section Visualization in Rhino
Axis Placements
The Axis Placement component defines important planes or stations along the bridge alignment. In SOFiSTiK, these stations are called “Placements”. Placements of Type “S” indicate the location of supports. This information is used by the program to define the span-layout of the bridge.
Note: Later in the workflow, other SOFiSTiK components will require the input of “stations”. They can be provided as numerical station values, station names or span-stations.
Placements can be rotated around the bridge alignment’s local x-axis, resulting in a rotation of the superstructure or superelevation. If the alignment has a vertical inclination, users can specify whether placements should remain vertical or perpendicual to the bridge axis.
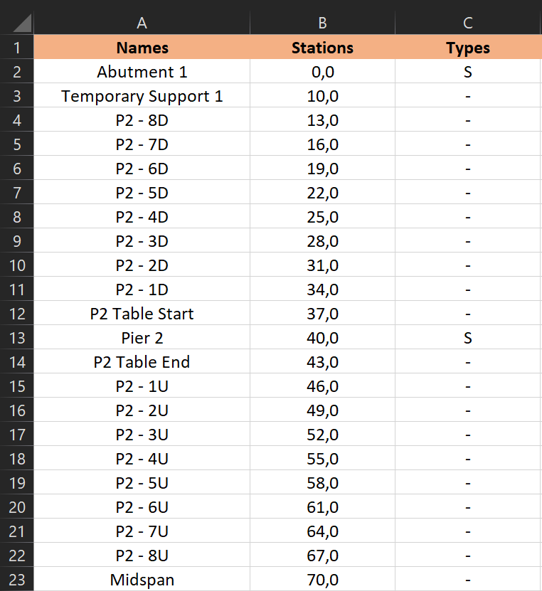
Figure 10. Excel Definition: Axis Placements
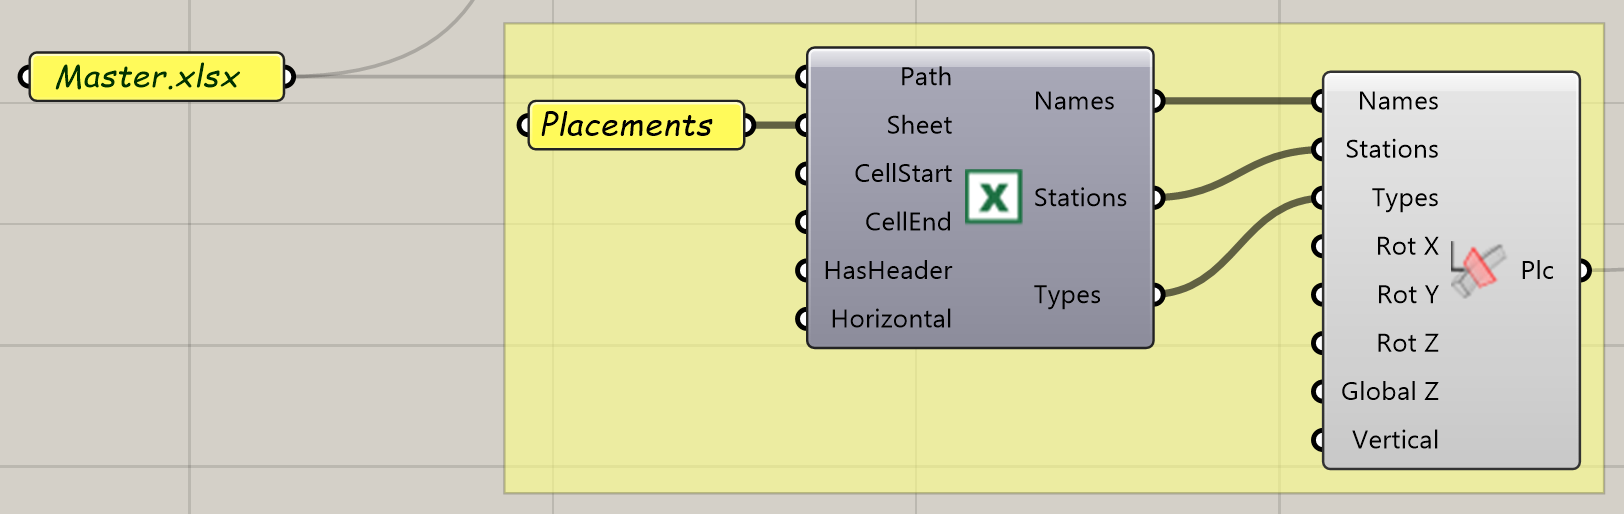
Figure 11. GH Script: Axis Placements
Axis Variables
Axis variables are cross section parameters that are not constant but variable along the bridge axis, for example the superstructure depth or superelevation. Using the Axis Variable Distribution by Points component, it’s possible to refer to a cross section parameter, and assign values to it at given stations. The transition at any given point can be polygonal (linear interpolation) or smooth (spline).
Station Types
By default, station values will be interpolated linearly. The following station types are available:
“#”: linear interpolation of variables at this station
“-“: a spline with a slope according to corresponding tangent is applied left of specified station
“+”: a spline with a slope according to corresponding tangent is applied right of specified station
“*”: a spline with a slope according to corresponding tangent is applied on both sides of specified station
“/”: a spline is applied which runs through the value at specified station and whose tangent is calculated automatically
The Read Spreadsheet component is used to read in values for variable H at specific stations.
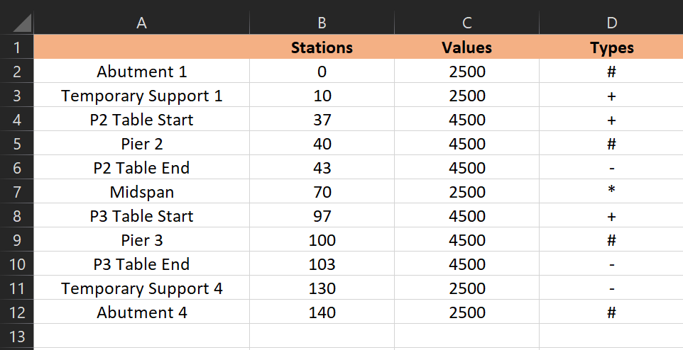
Figure 12. Excel Definition: Axis Variables
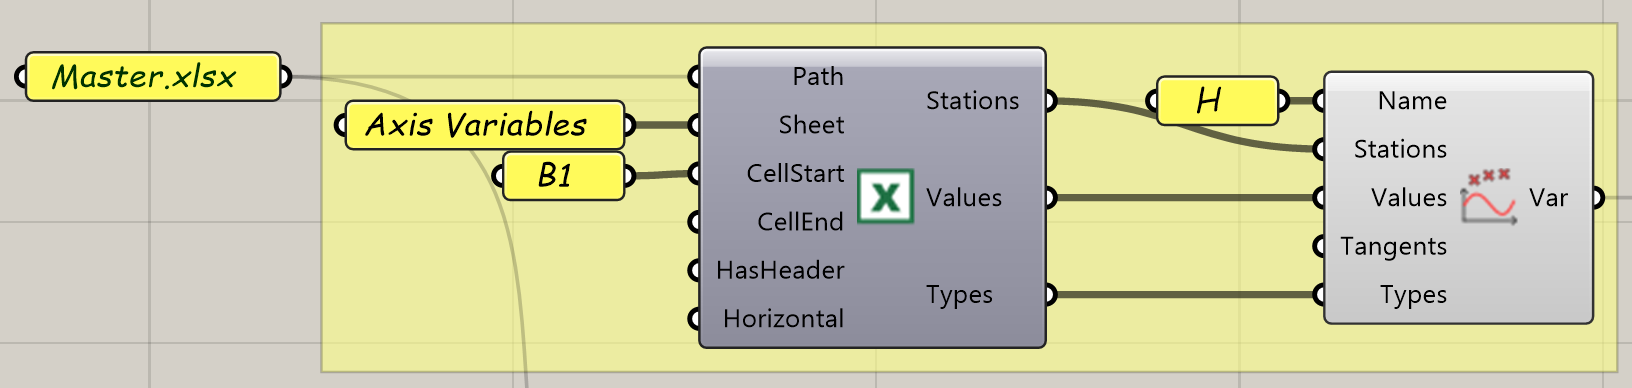
Figure 13. GH Script: Axis Variables
The Axis Variable Distribution component will show a diagram of the defined variable distrubutions.
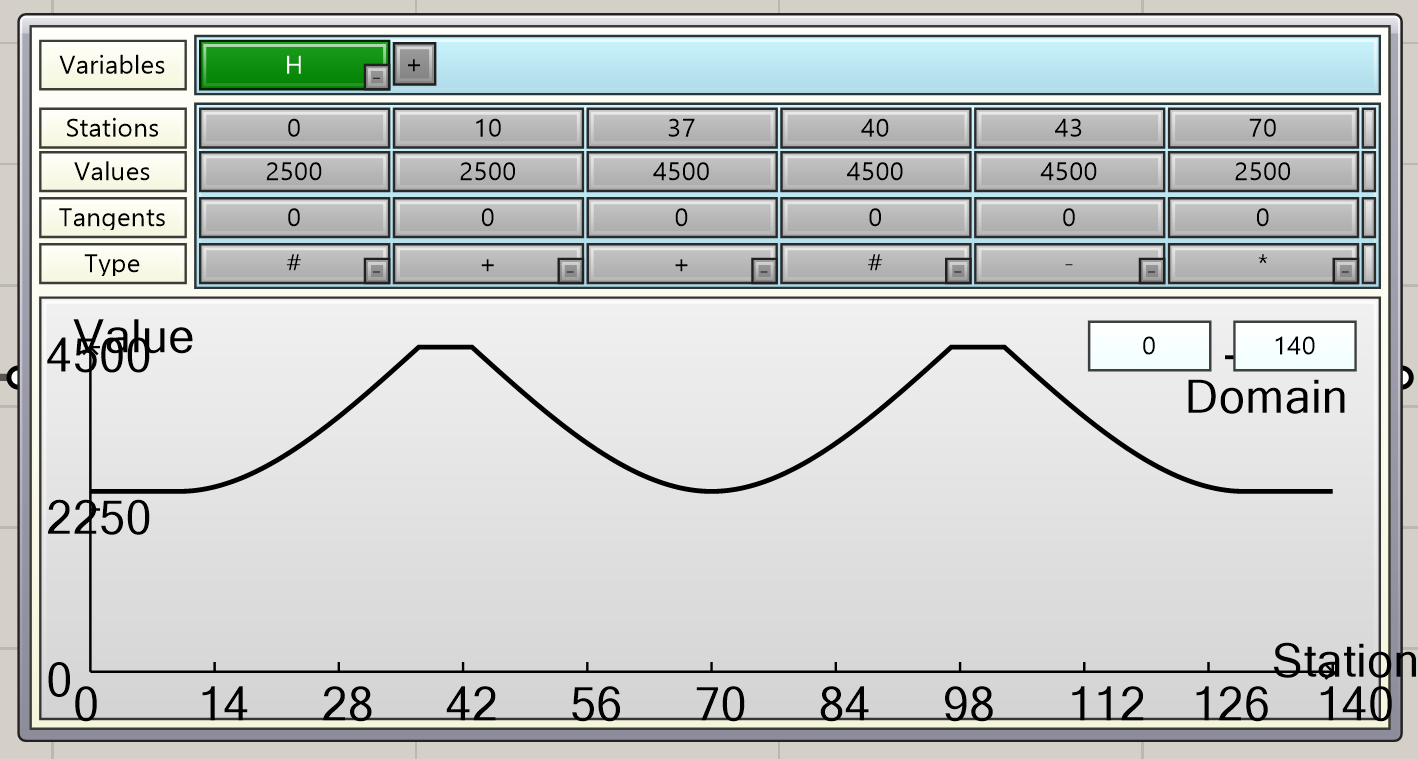
Figure 14. Axis Variable Distribution
Axis Definition
The Axis Definition component collects the road alignment, the bridge cross section and corresponding axis variables and the placements, and builds the basis for the bridge geometric and analytical models. Clicking on the component will preview the placements in Rhino. The Interpolate Solid component creates a solid volume object of the bridge superstructure. By default, the solid is split at the placements. From a data structure perspective, every segment is stored in a separate tree branch. Right clicking on the Interpolate Solid component and pressing “Bake” will bring the 3d objects of the bridge superstructure into Rhino.
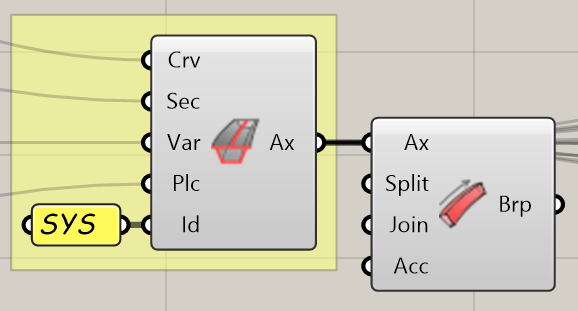
Figure 15. GH Script: Axis Definition and Superstructure Geometric Model
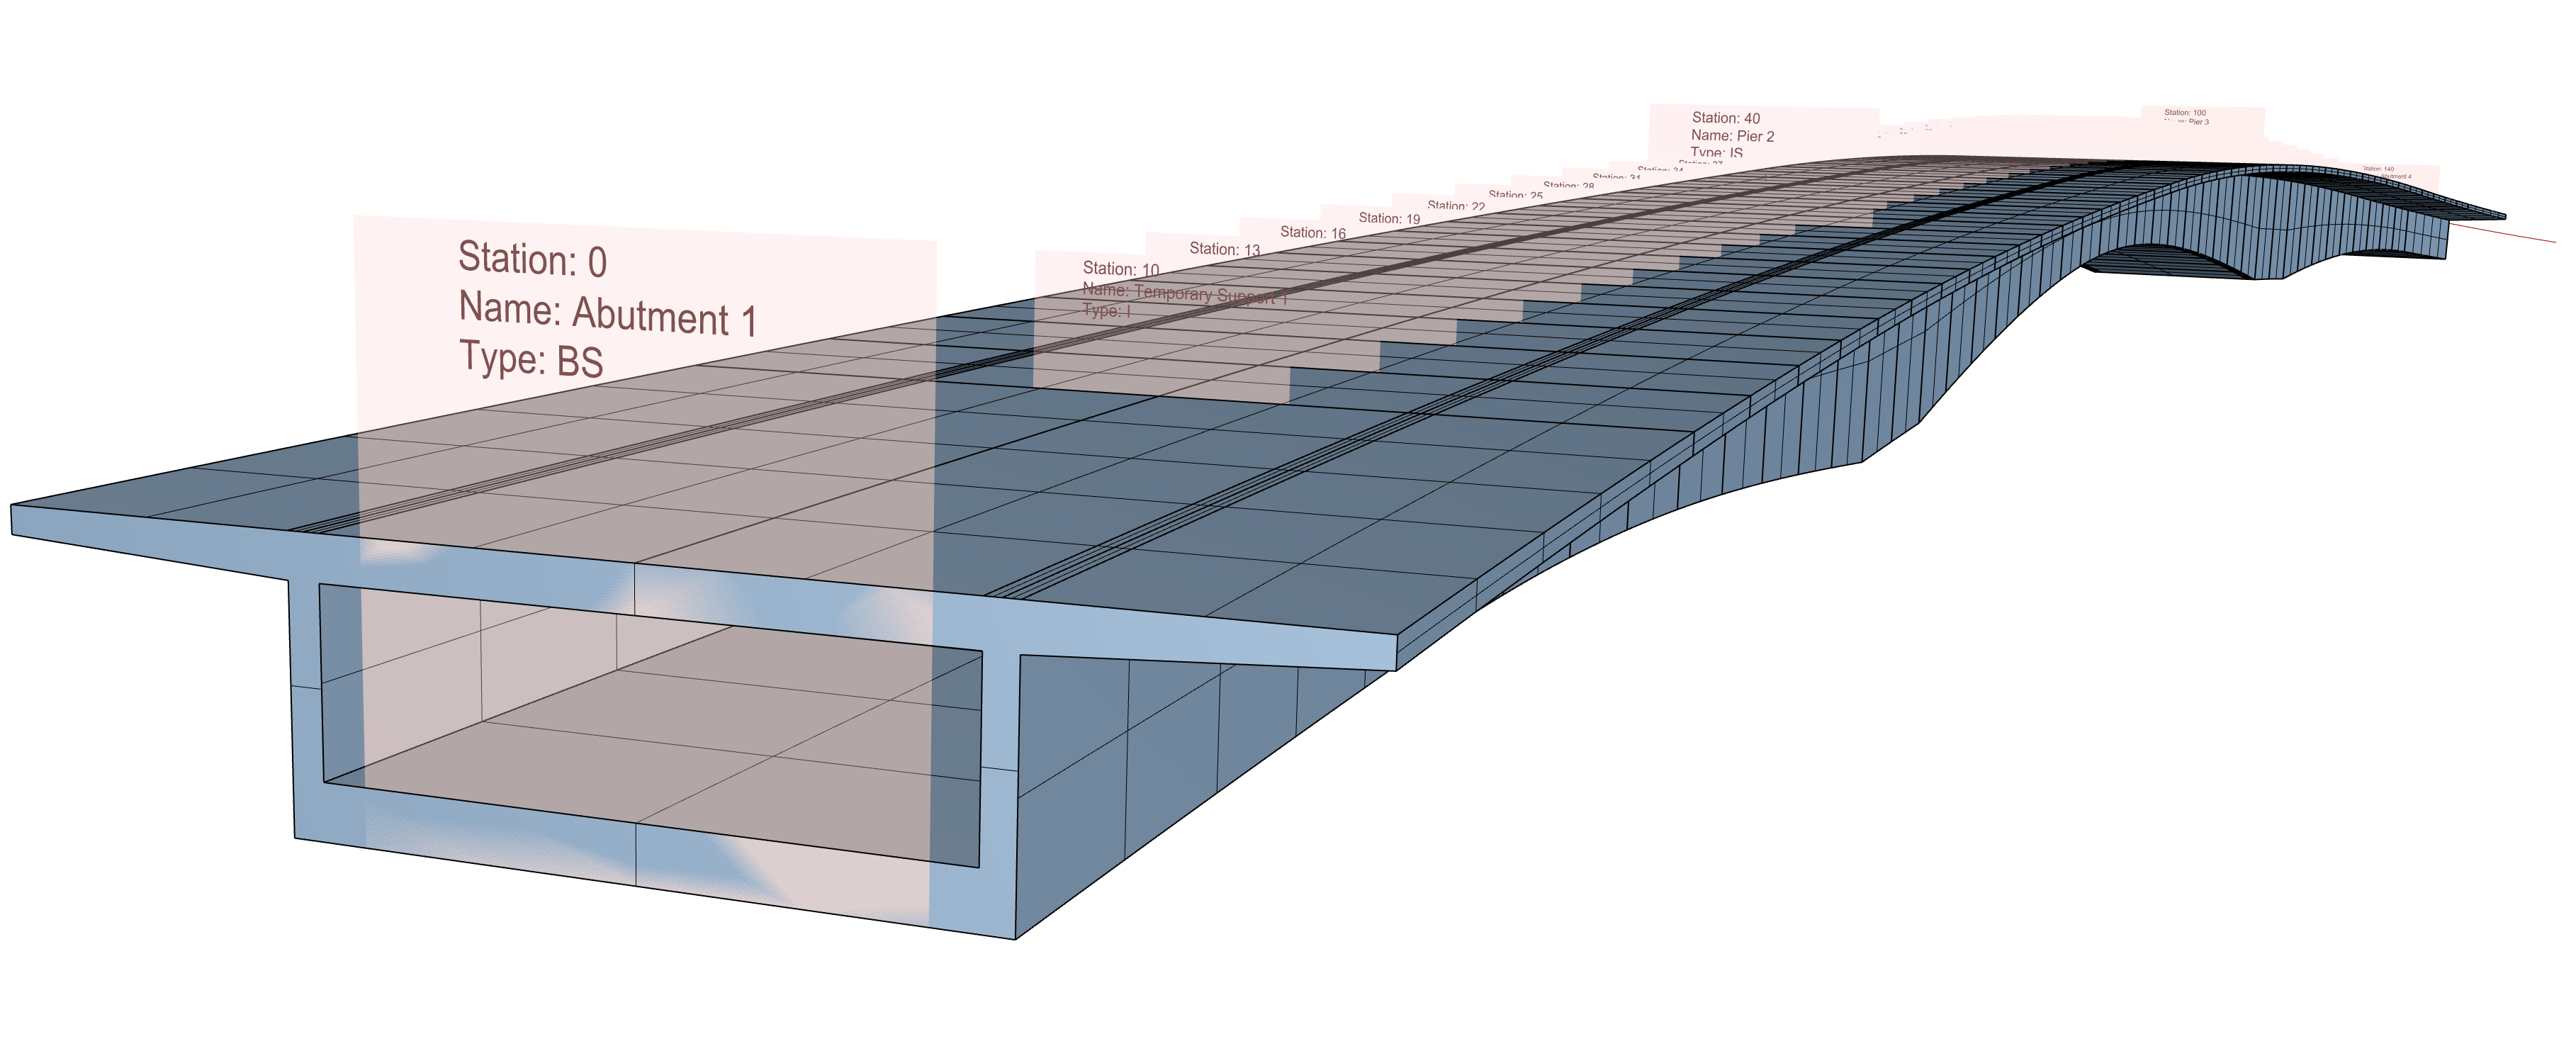
Figure 16. Baked Superstructure and Placements
Superstructure Analytical Model
Superstructure Structural Lines
The Interpolate Curve component uses cross section points to create curves along the bridge axis. The curves can be used to define the superstructure Structural Lines. The component organizes each curve segment in a separate tree branch. To assign a different group number to the individual structural lines, the input data should be grafted.
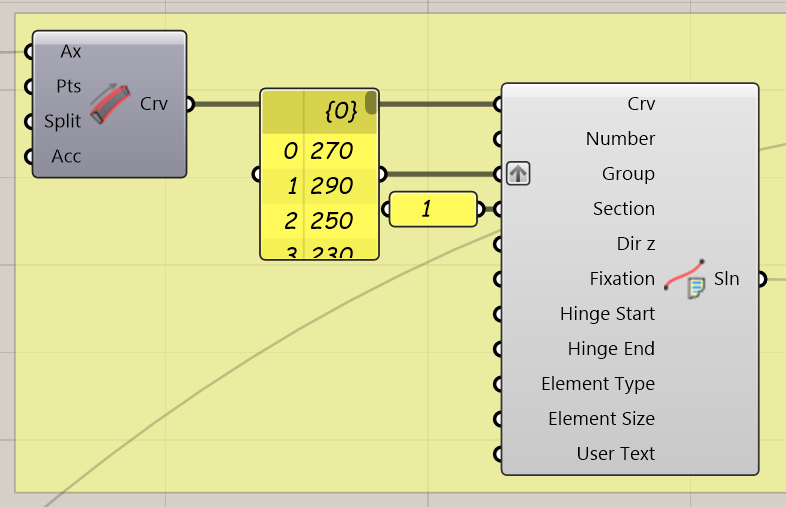
Figure 17. GH Script: Superstructure Structural Lines
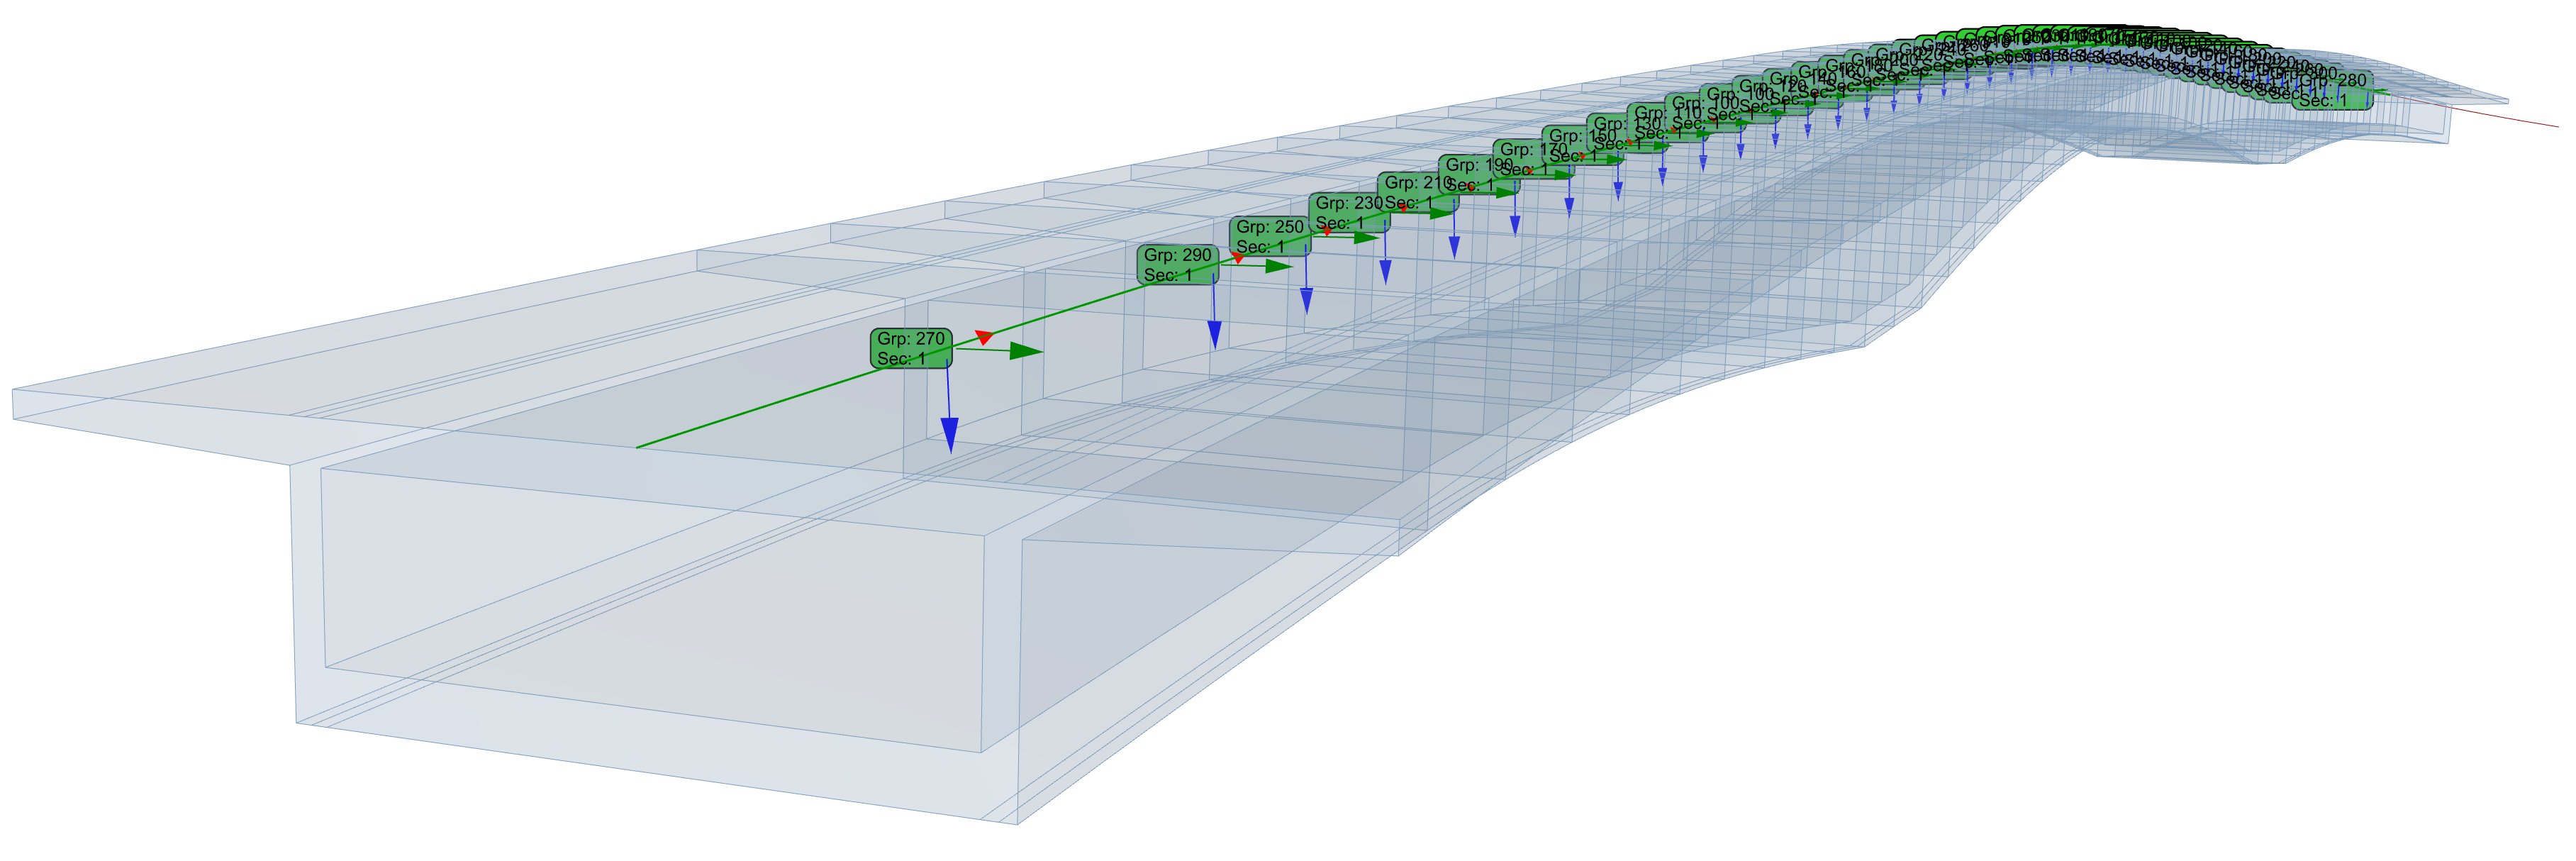
Figure 18. Preview of the Superstructure Analytical Lines and Structural Properties
Superstructure Support Conditions
The Evaluate Section component is used to retrieve cross section points at a given station or list of stations. This can be used to define the superstructure´s analytical supports. In this example, the points LS and RS are used to define Elastic Couplings that represent elastomeric bearing pads. (Rigid-) Couplings are used to consider the eccentricity between the road axis and the bearings.
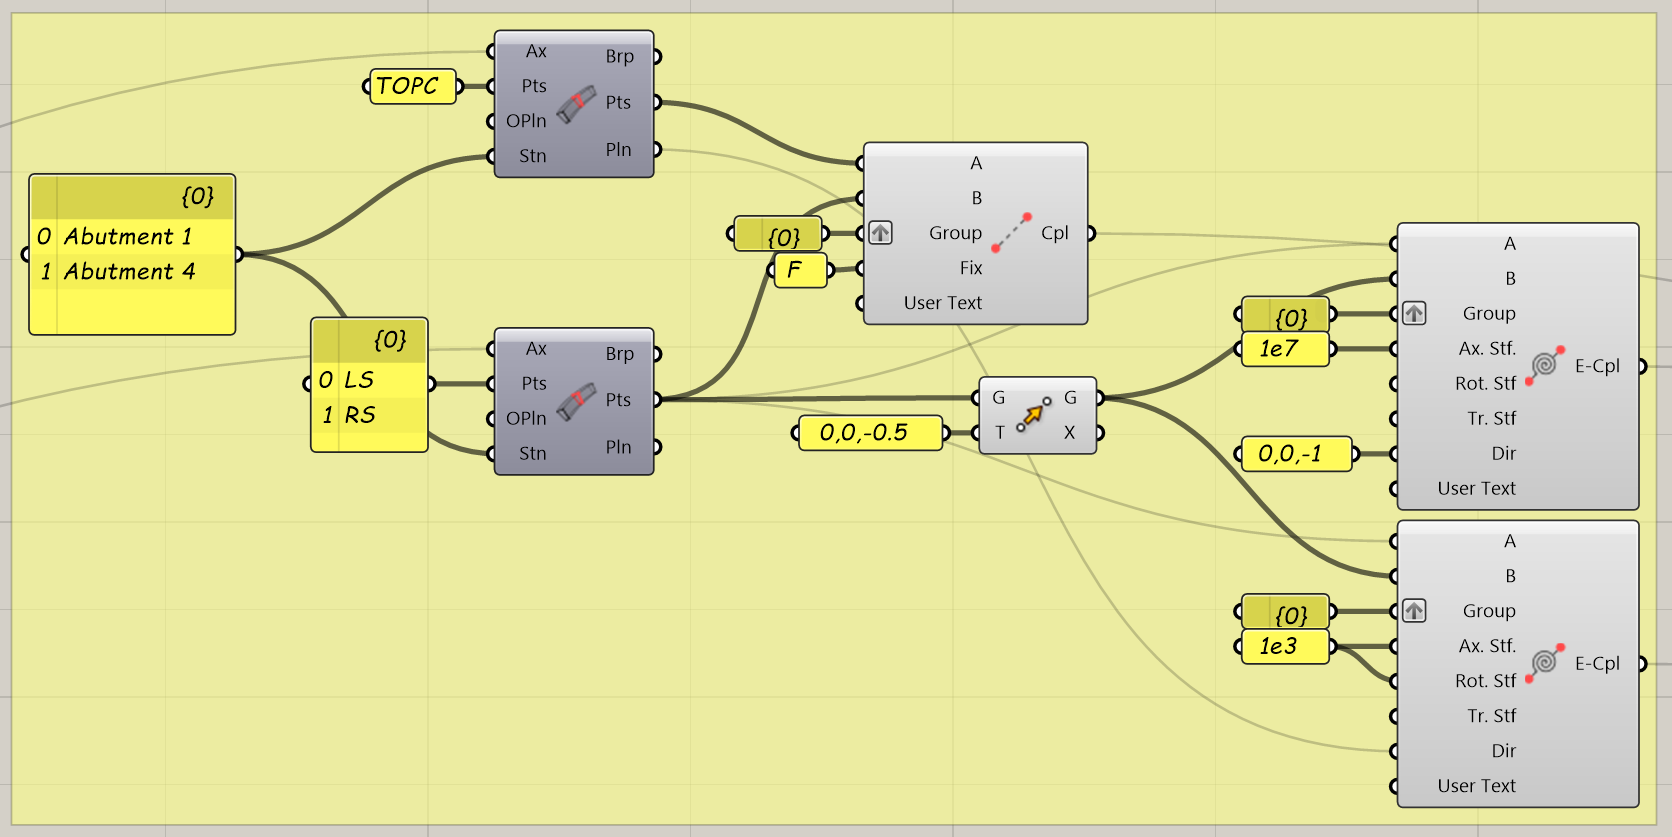
Figure 19. GH Script: Support Conditions at Abutments
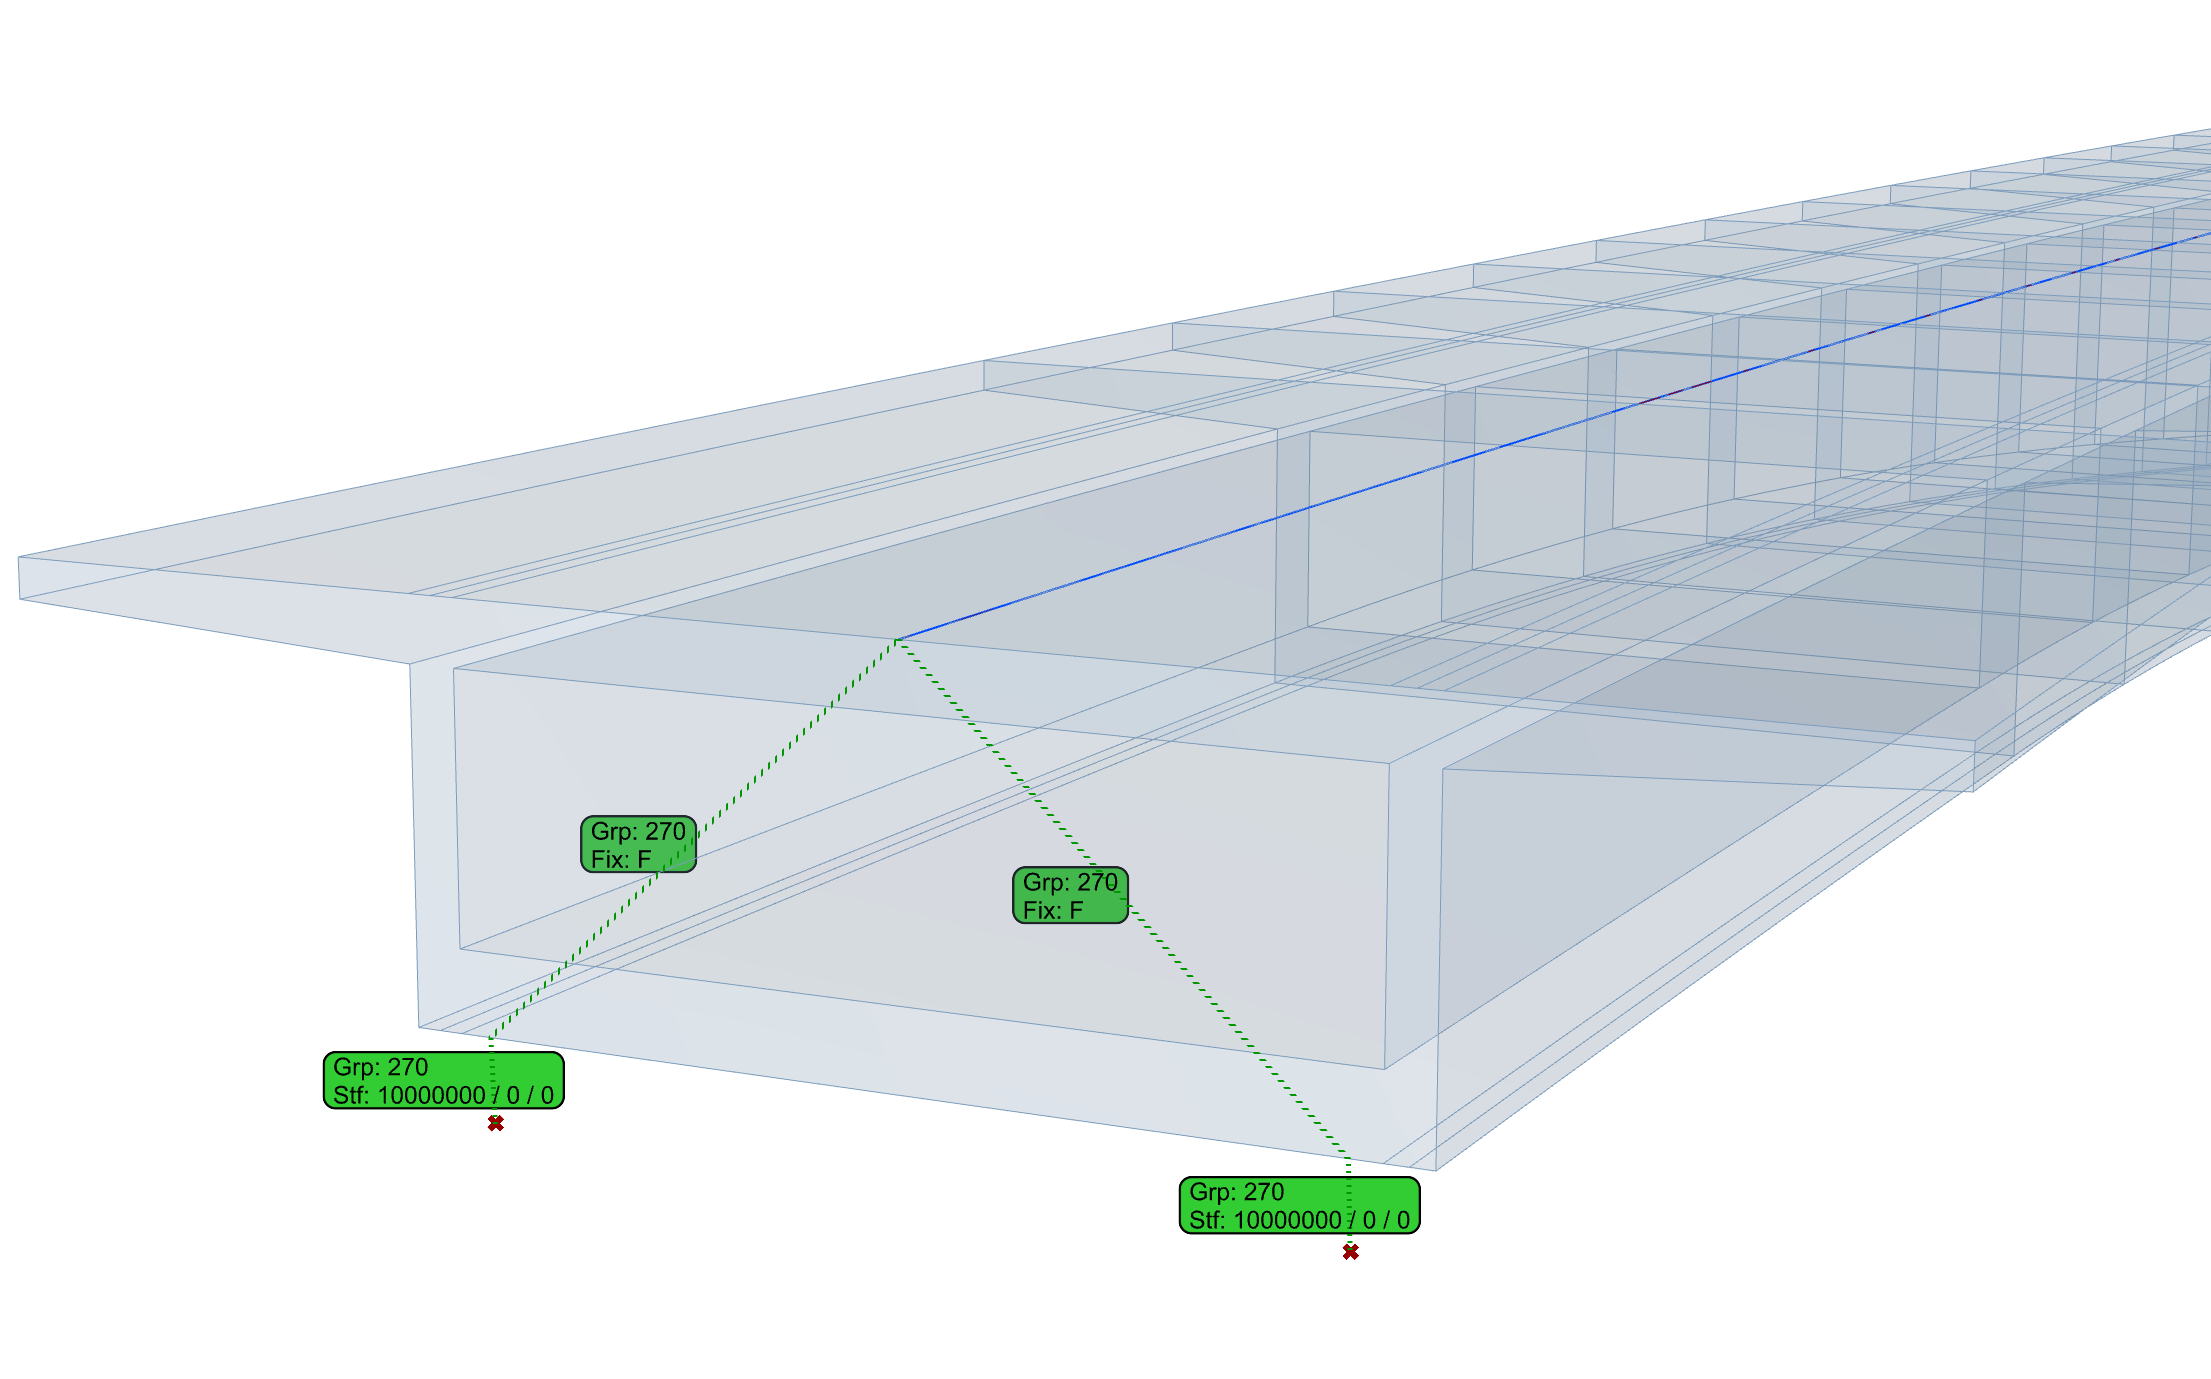
Figure 20. Preview of the Support Conditions at Abutment 1
Tendon Definition
Cantilever tendons have been defined with the help of a spreadsheet.
Tendon Nr. 101 has horizontal offset from the bridge axis of 3m, and a vertical offset of 0.15m. It starts at station “P2–1D” and ends at station “P2–1U”. Its construction stage numbers for stressing and grouting are 125 and 126 and it has a total count of 3 tendons.
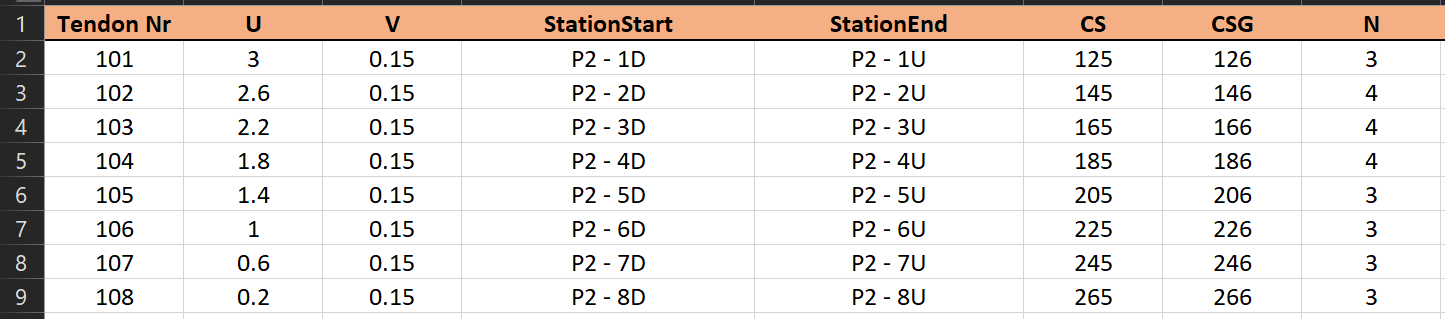
Figure 21. Excel Definition: Cantilever Tendons Pier 3 East
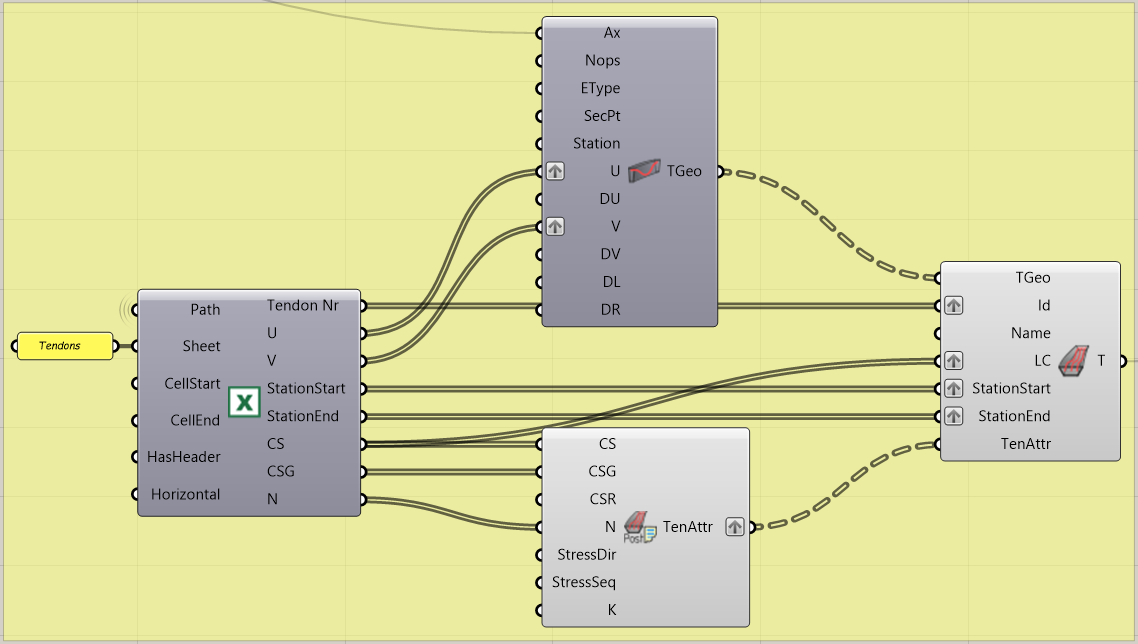
Figure 22. GH Script: Cantilever Tendons
Continuity tendons follow the varying cross section point TEND.
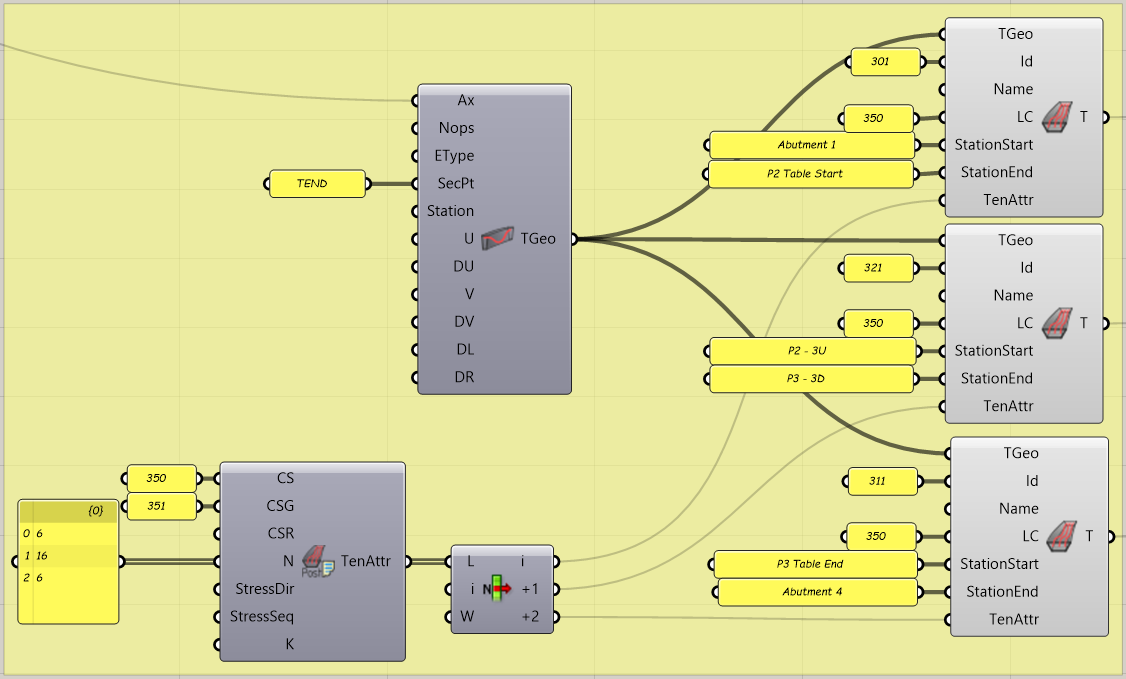
Figure 23. GH Script: Continuity Tendons
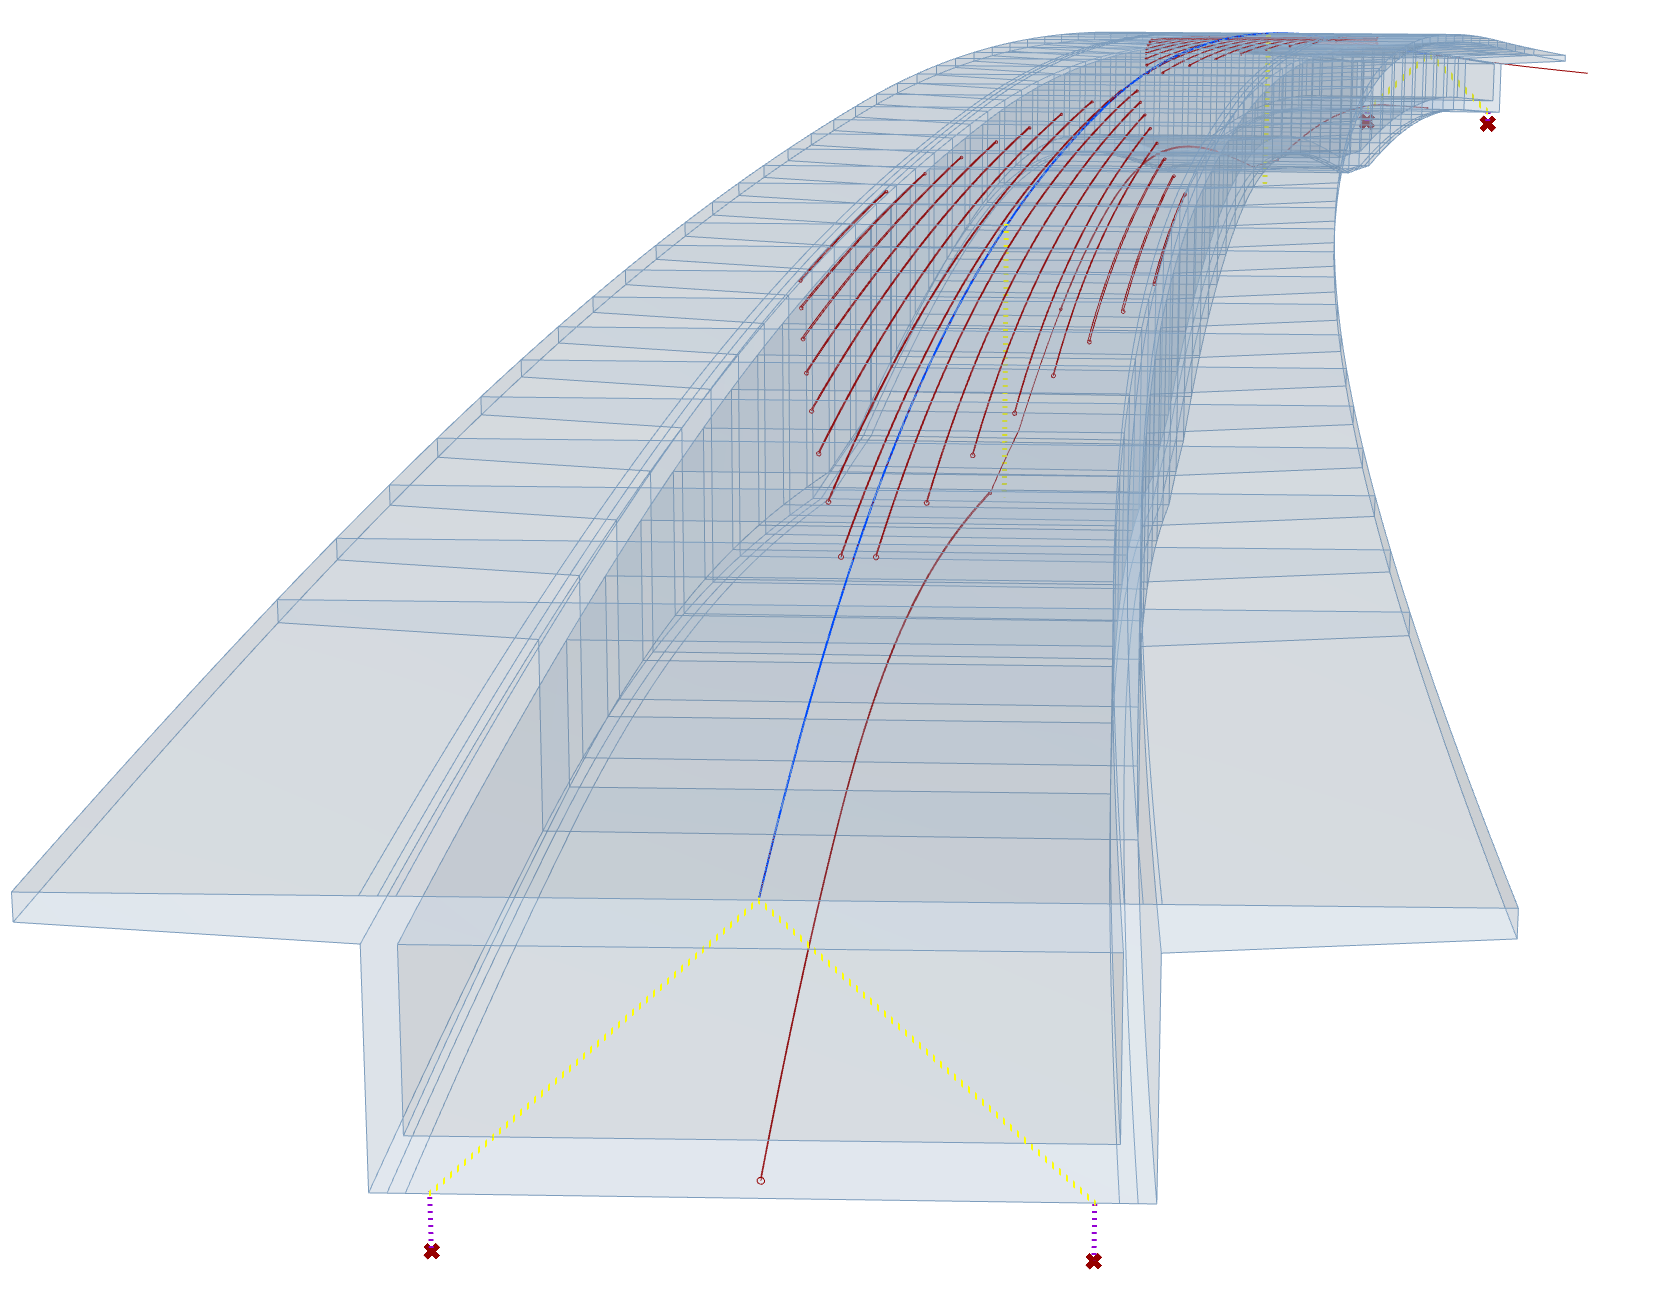
Figure 24. Preview of the Tendons
Substructure Geometric and Analytical Models
The substructure piers and abutments use a simple rectangular cross section. It has been defined near the system origin using standard Grasshopper components and SOFiSTiK components Section Attributes and SectionFromBrep.
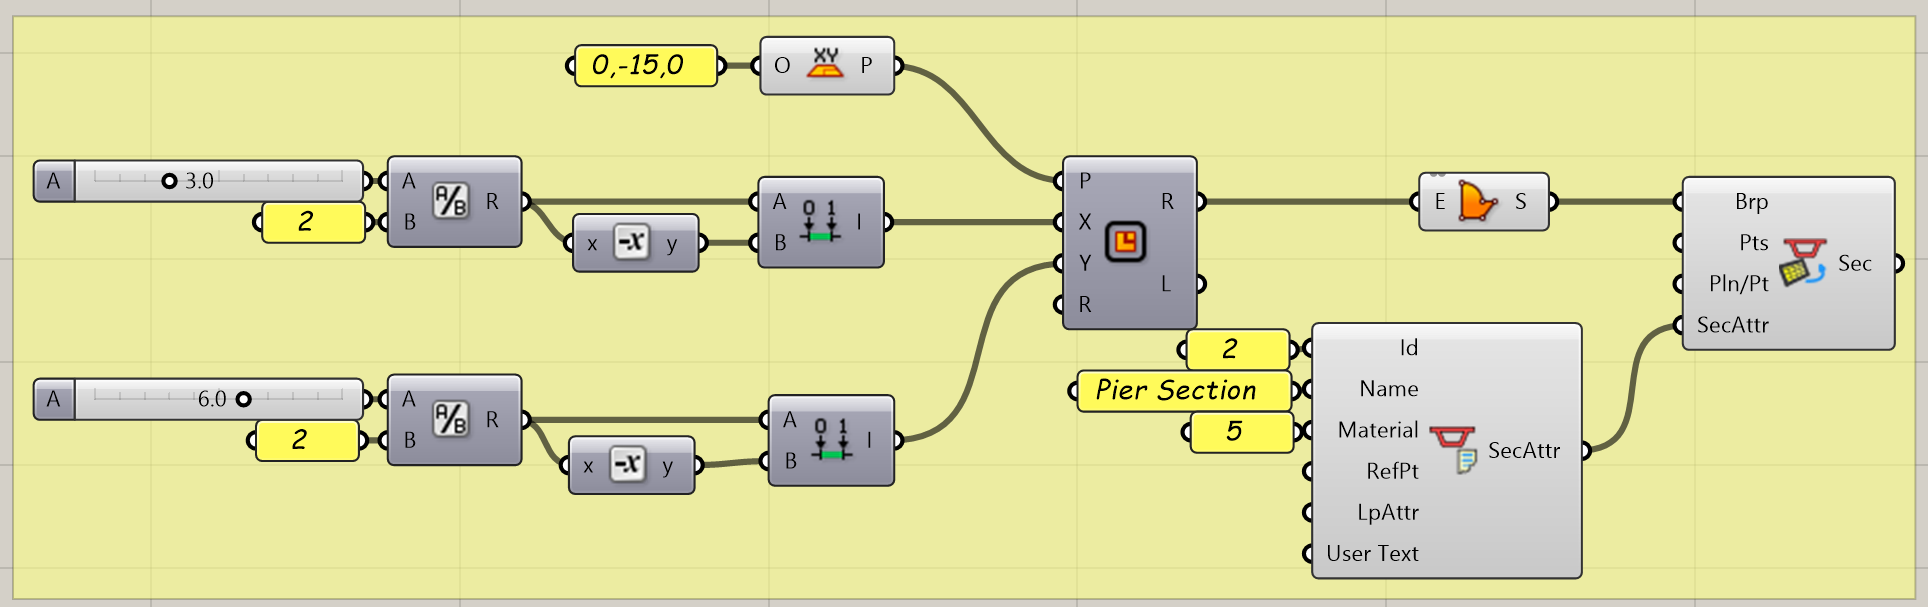
Figure 25. GH Script: Pier Section definition
The Placement Transform component can be used to place the defined cross section at the placements. The substructure geometric and analytical models can be defined using standard Grasshopper component, as well as SOFiSTiK Structural Line, Structural Point and Coupling components.
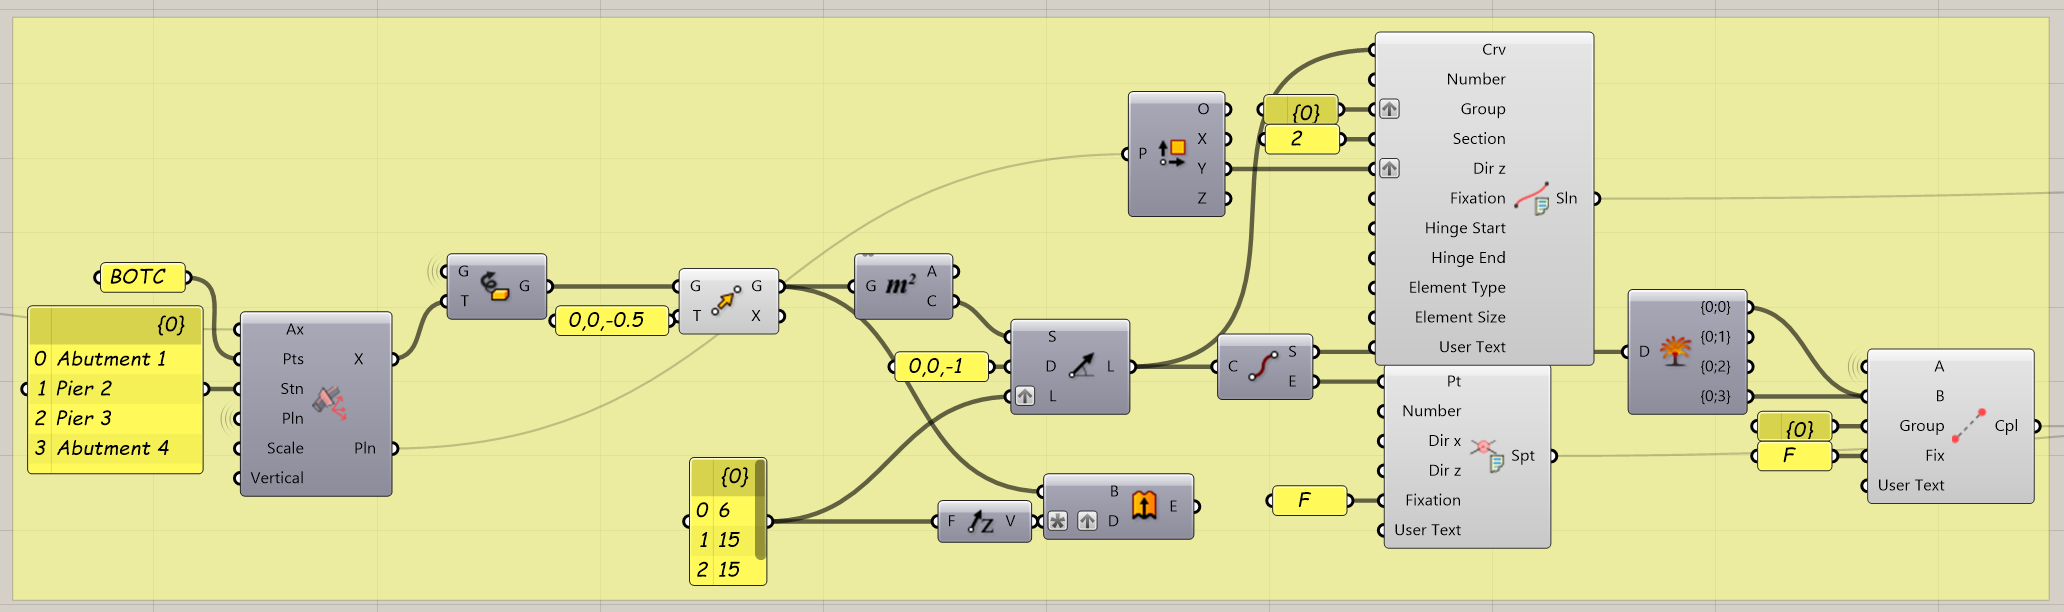
Figure 26. GH Script: Pier Geometric and Analytical Models
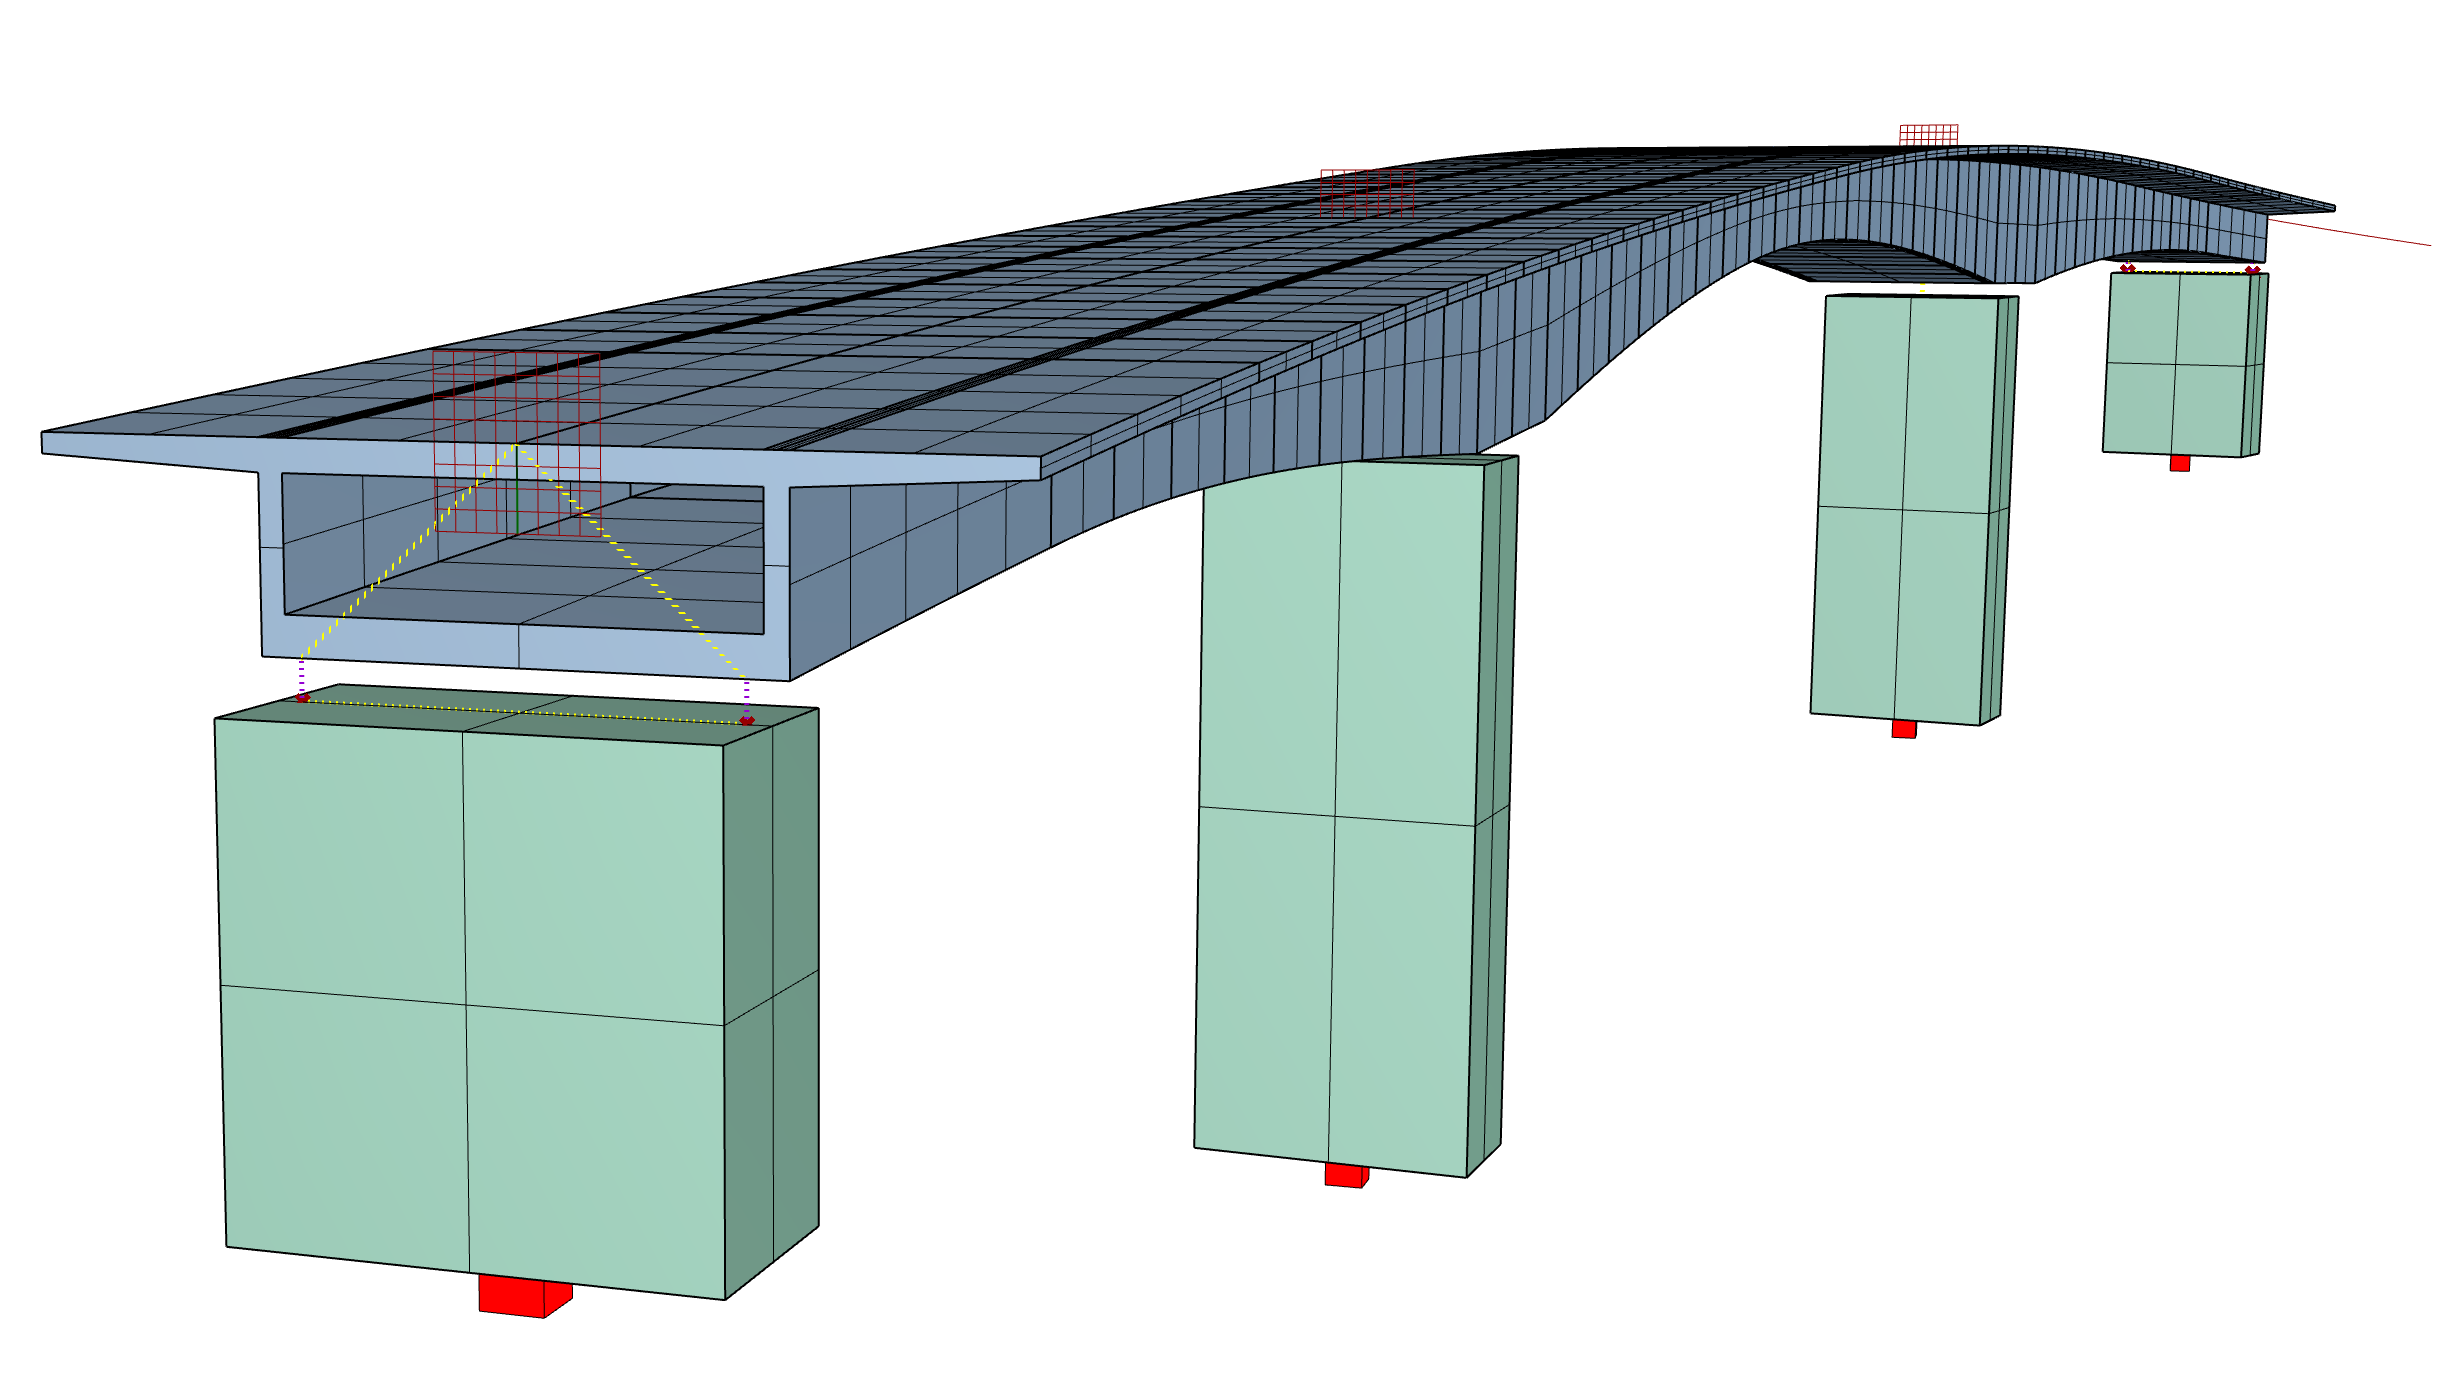
Figure 27. Preview of the Bridge Geometric and Analytical Models
Generating a SOFiSTiK Model
Cross Sections
Use the AQUA component to automatically generate the CadInp code needed to run cross sections in SOFiSTiK. Use the Text File component to stream the generated data into your project folder. Save the file as “Sections.dat”.
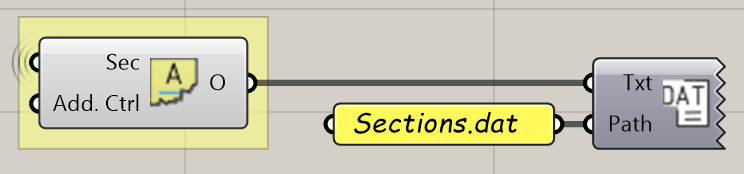
Figure 28. GH Script: Data for SOFiSTiK - Cross Sections
Structural Elements
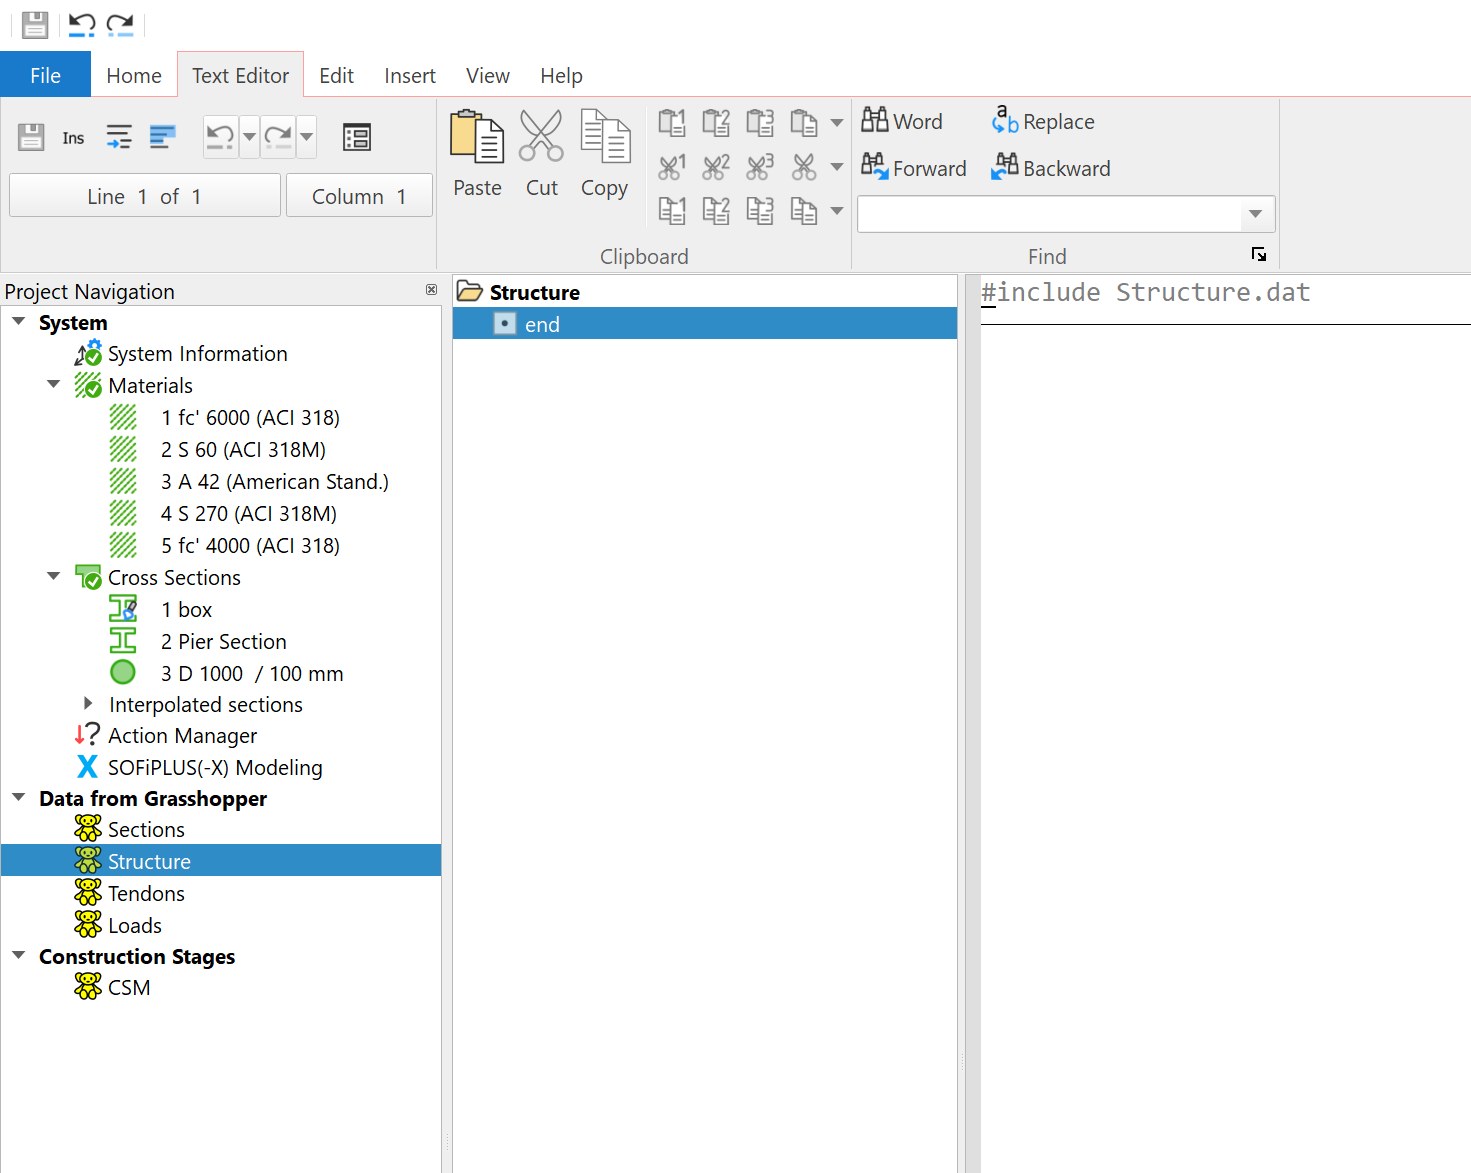
Use the SOFiMSHC component to automatically generate the code needed to run the structural model and create a finite element model in SOFiSTiK. Note that the bridge axis is needed to interpolate the varying cross sections. Use the Text File component to stream the generated data into your project folder. Save the file as “Structure.dat”.
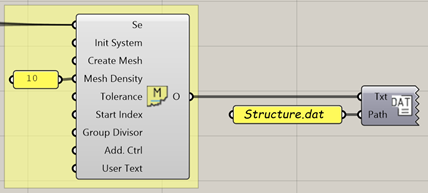
Figure 29. GH Script: Data for SOFiSTiK - Structural Elements
Loads
Use the SOFiLOAD component to automatically generate the code needed to run loads in SOFiSTiK. Use the Text File component to stream the generated data into your project folder. Save the file as “Loads.dat”.
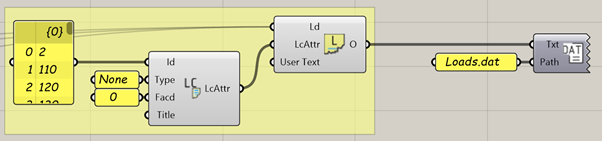
Figure 30. GH Script: Data for SOFiSTiK - Loads
Tendons
Use the TENDON component to automatically generate the code needed to run the tendons. Use the Text File component to stream the generated data into your project folder. Save the file as “Tendons.dat”. Define a prestressing system using the Prestressing System component.
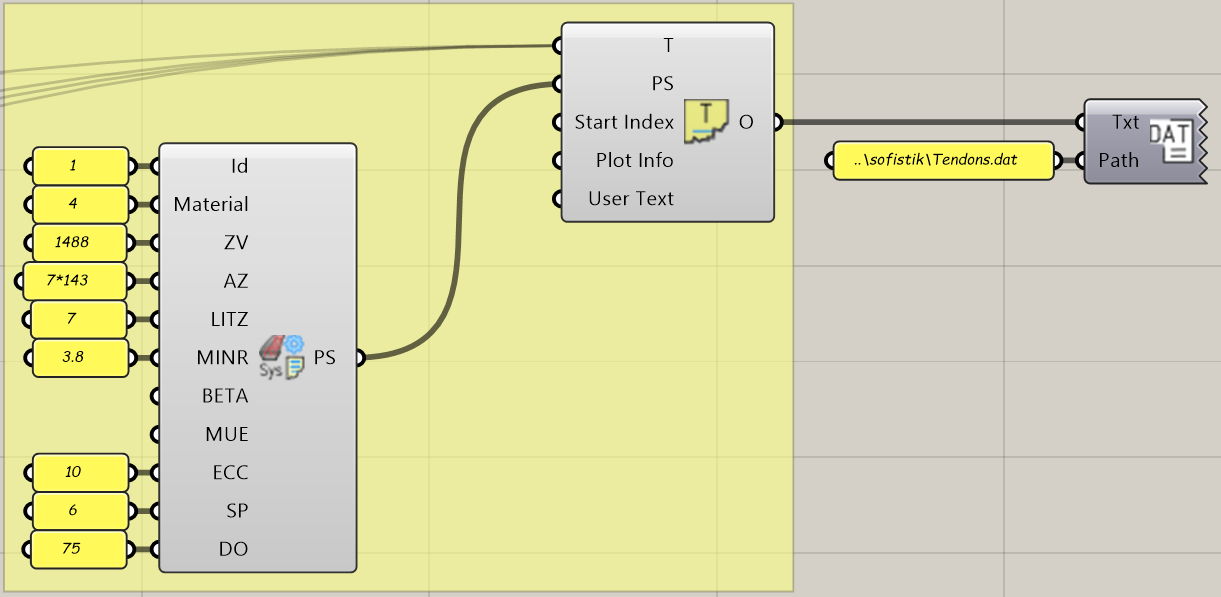
Figure 31. GH Script: Data for SOFiSTiK - Tendons