Theoretical Principles of Capacity Check
Relative Capacity
The bearing capacity of a cross-section depends on the material stiffnesses, the dimensions of the cross-section, as well as the quantity and positioning of the reinforcement. A measure of the capacity of the cross section is the relative capacity \(Ed/Rd \quad\) which compares the acting forces \(F_{Ed}\) to the the forces that the cross section can resist \(F_{Rd}\) . The relative capacity is determined as the ratio of the length of the reaction force vector to the action force vector. In order for the relative capacity to be computed the reaction and the action force vector have to be aligned and this is achieved by iterating for the limit strain state. The limit strain state is controlled by two strain parameters
\(s \quad\) identifying the \(N-My \quad\) interaction (\(s=-1.0 \quad\) pure compression, \(s=+1.0 \quad\) pure tension)
\(\theta_{\kappa} \quad\) the angle between \(k_{y}\) and \(k_{z}\) curvatures, as measure to the rotation of the strain \(M_{y}-M_{z} \quad\) plane
The alignment of the reaction and action force vector is determined by a double residual condition minimizing
\(\alpha \quad\) the angle between the force vector’s projection in \(N-M_{y} \quad\) plane
\(\beta \quad\) the angle between the force vectors in \(M_{y}-M_{z} \quad\) plane.
The iterative scheme for the update of strain parameters is based on the linearization of the residual formulation.
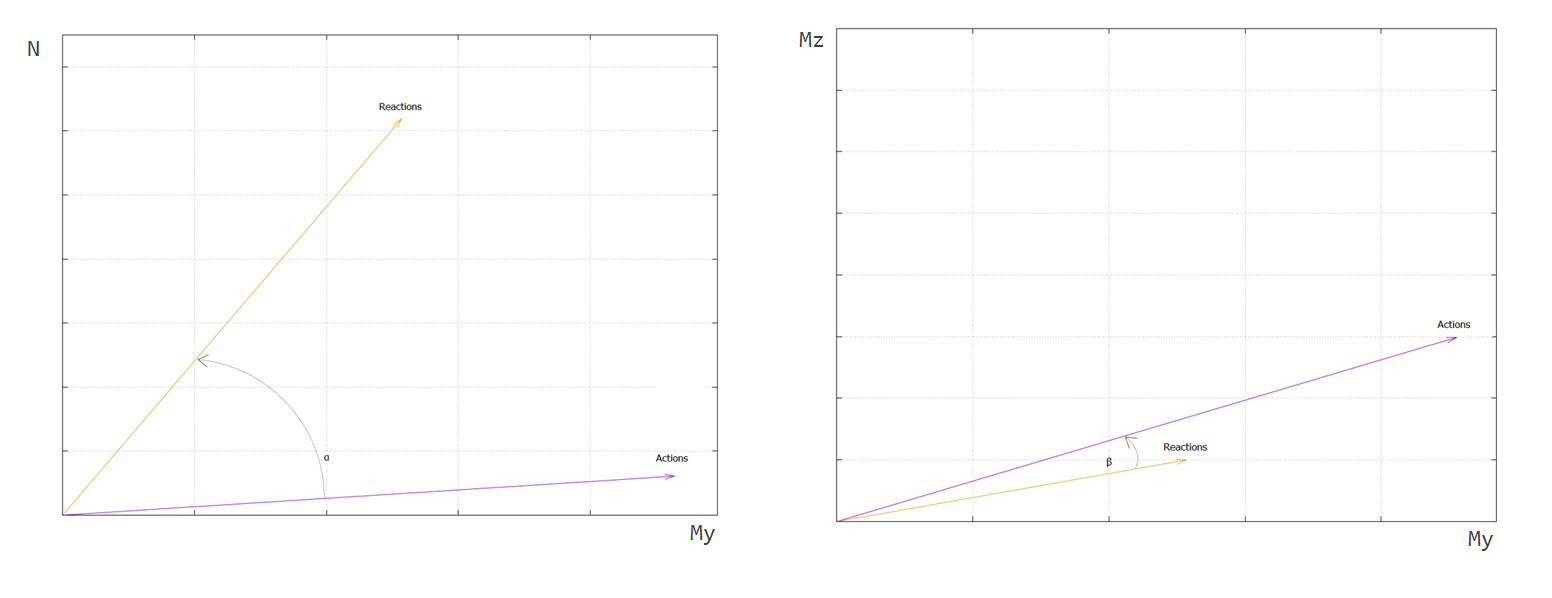
Reaction and action force vector in \(N-M_{y} \quad\) (left) and \(M_{y}-M_{z} \quad\) plane (right) (click to enlarge)
Interaction Curves
The normal force and biaxial bending capacity interaction curves, that form the interaction surface, are generated according to a set of limit strains. Each interaction curve is defined by the requested \(M_{y}-M_{z} \quad\) plane, which is achieved by scaling the curvatures \(k_{y}\) and \(k_{z}\) accordingly, as well as the normal force range from pure compression to full tension. Any single point on an interaction curve defines the capacity of the cross section to carry the corresponding normal force and biaxial bending moments. This serves as a measure to evaluate if a set of acting forces defining a discrete point in \(N-M_{y}-M_{z} \quad\) space falls outside the curve, which would indicate that the demand exceeds the capacity of the cross section and the relative capacity ratio would be lower than \(1.0\). A section cut through the 3D surface would represent the \(M_{y}-M_{z} \quad\) interaction curve for a specific \(N_{Ed} \quad\) normal force level, as shown in the figure:
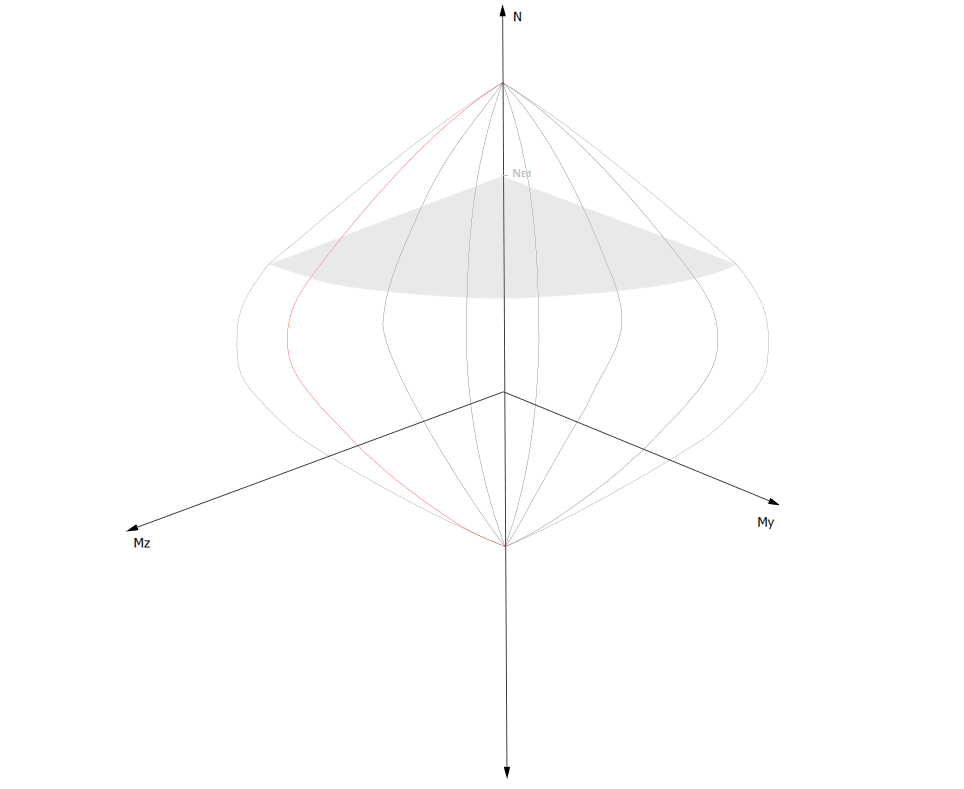
Capacity interaction surface \(N-M_{y}-M_{z} \quad\) (click to enlarge)
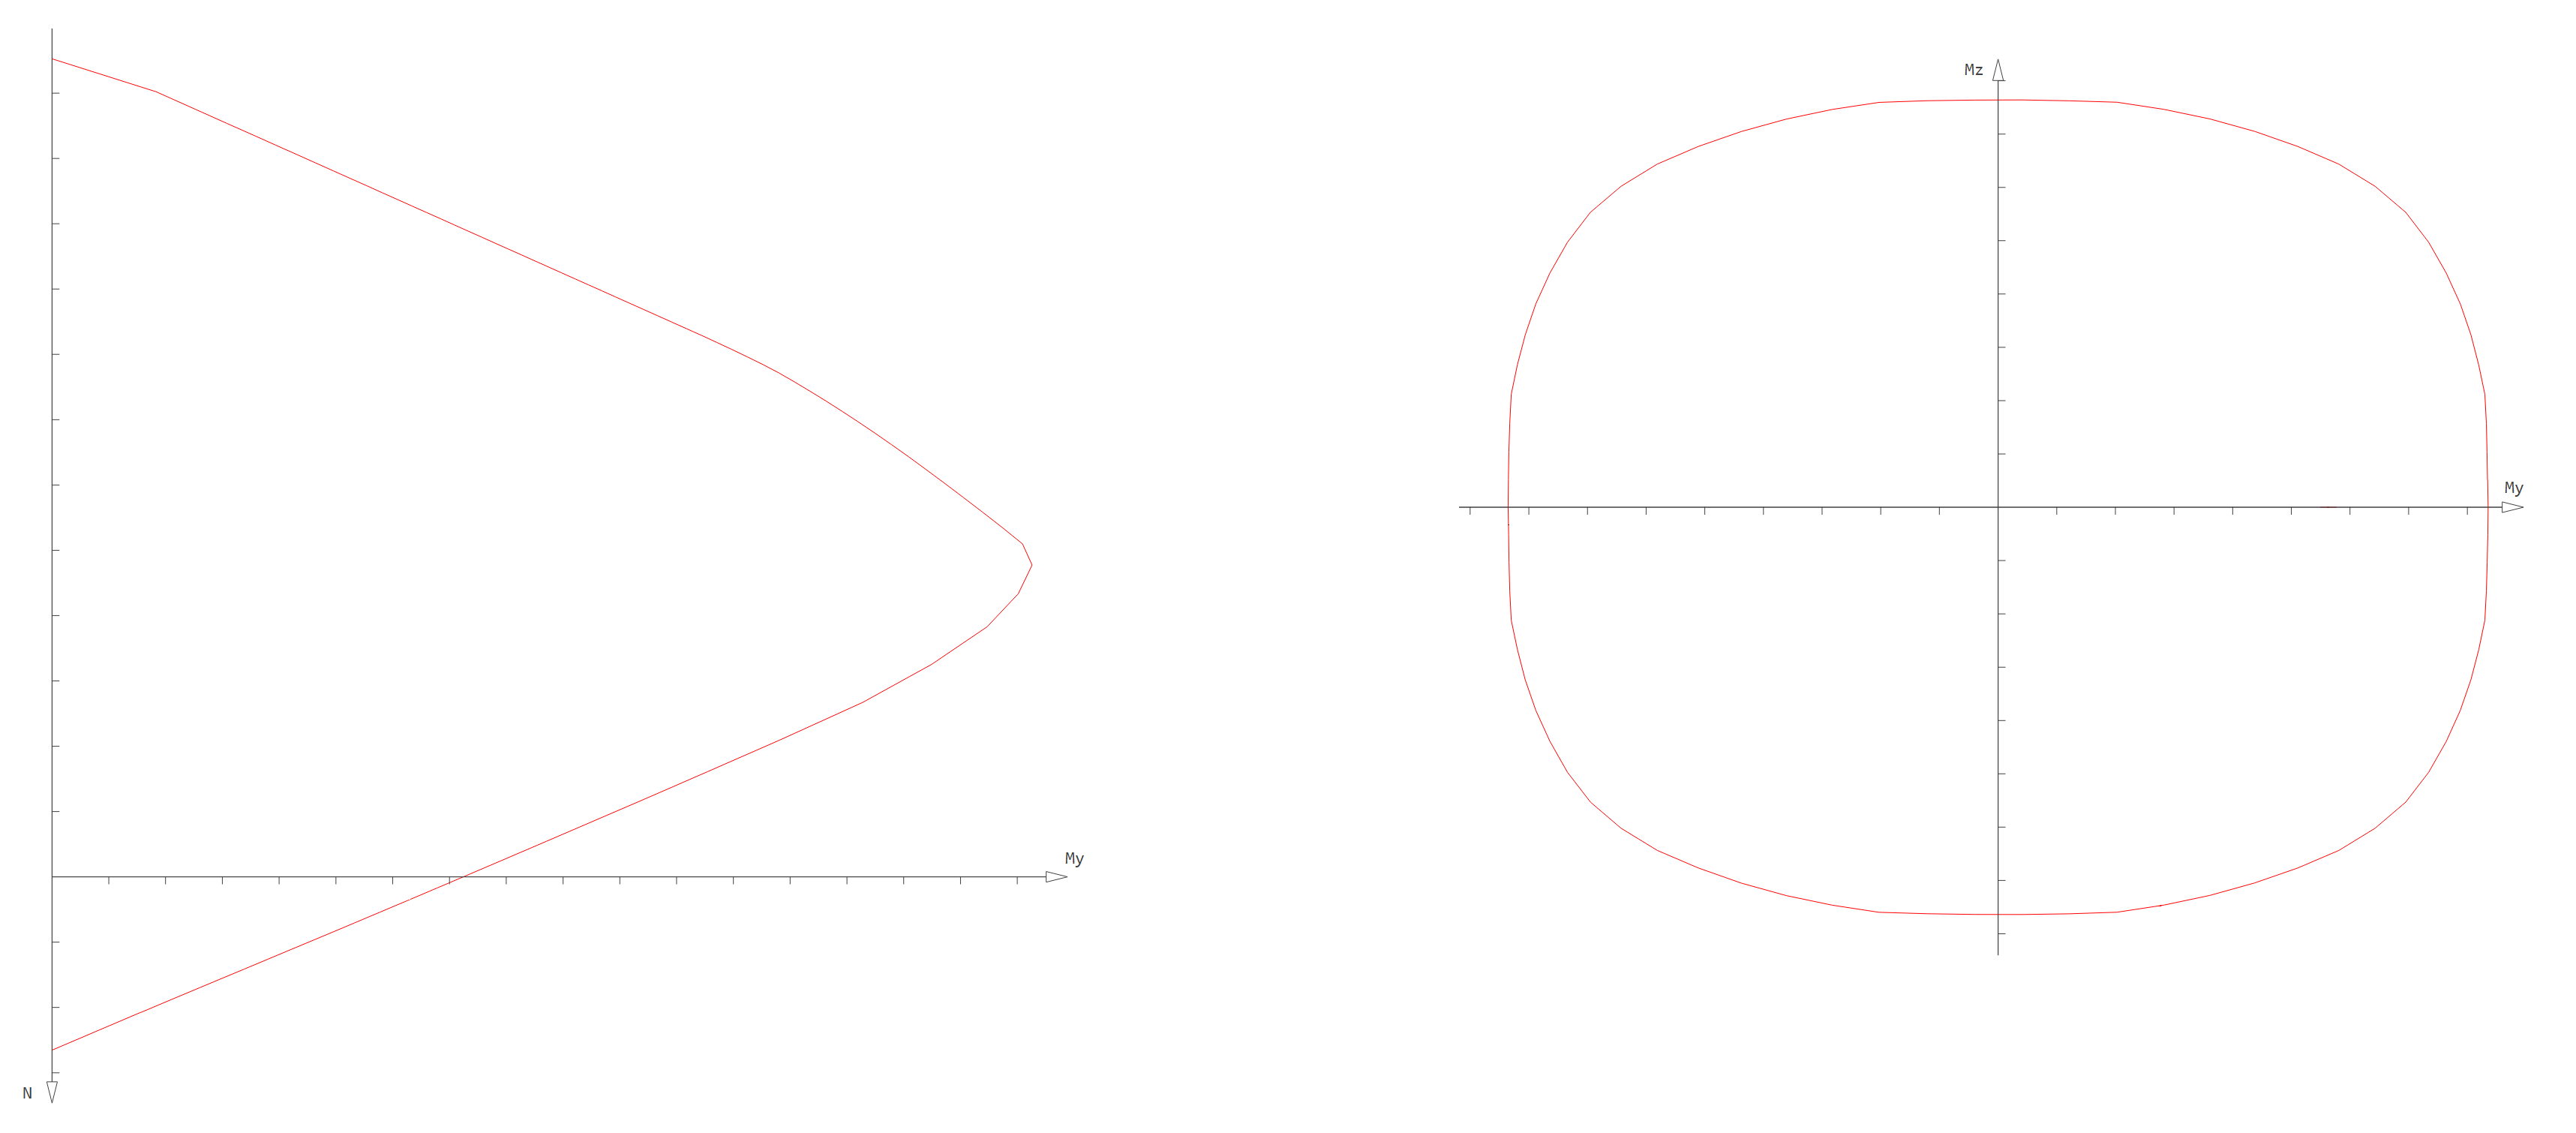
\(N-M_{y} \quad\) interaction curve (left), \(M_{y}-M_{z} \quad\) interaction curve (right) (click to enlarge)


