Post-Tensioned Concrete Box Girder Bridge
Introduction
Latest version:
![]()
post-tensioned-box-girder-bridge-2022-2.zip
Version history
![]()
post-tensioned-box-girder-bridge-2022-2.zip
![]()
post-tensioned-box-girder-bridge-2022-0.zip
![]()
post-tensioned-box-girder-bridge-2020-10.zip
![]()
post-tensioned-box-girder-bridge-2020-9.zip
![]()
post-tensioned-box-girder-bridge-2020-8.zip
![]()
post-tensioned-box-girder-bridge-2020-7.zip
![]()
post-tensioned-box-girder-bridge-2020-6.zip
![]()
post-tensioned-box-girder-bridge-2020-5.zip
Using the gh_sofistik plugin for Grasshopper, we will define the geometric and analytical models of a post-tensioned concrete box girder bridge in 10 easy steps:
Objectives
Define important stations along the alignment called “placements”
Define tendon profiles by interpolating between varying cross section points
Collect all data to build the bridge axis and create the superstructure geometric model
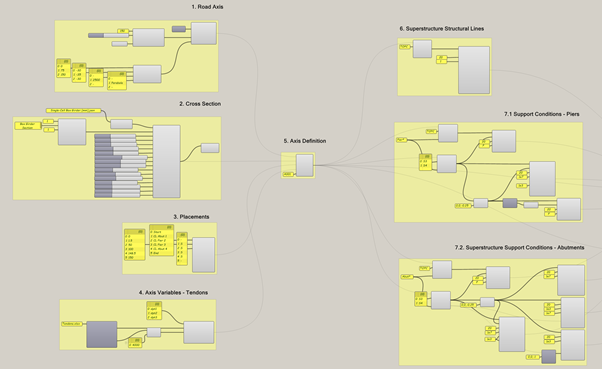
Figure 1. Part of the Grasshopper Script
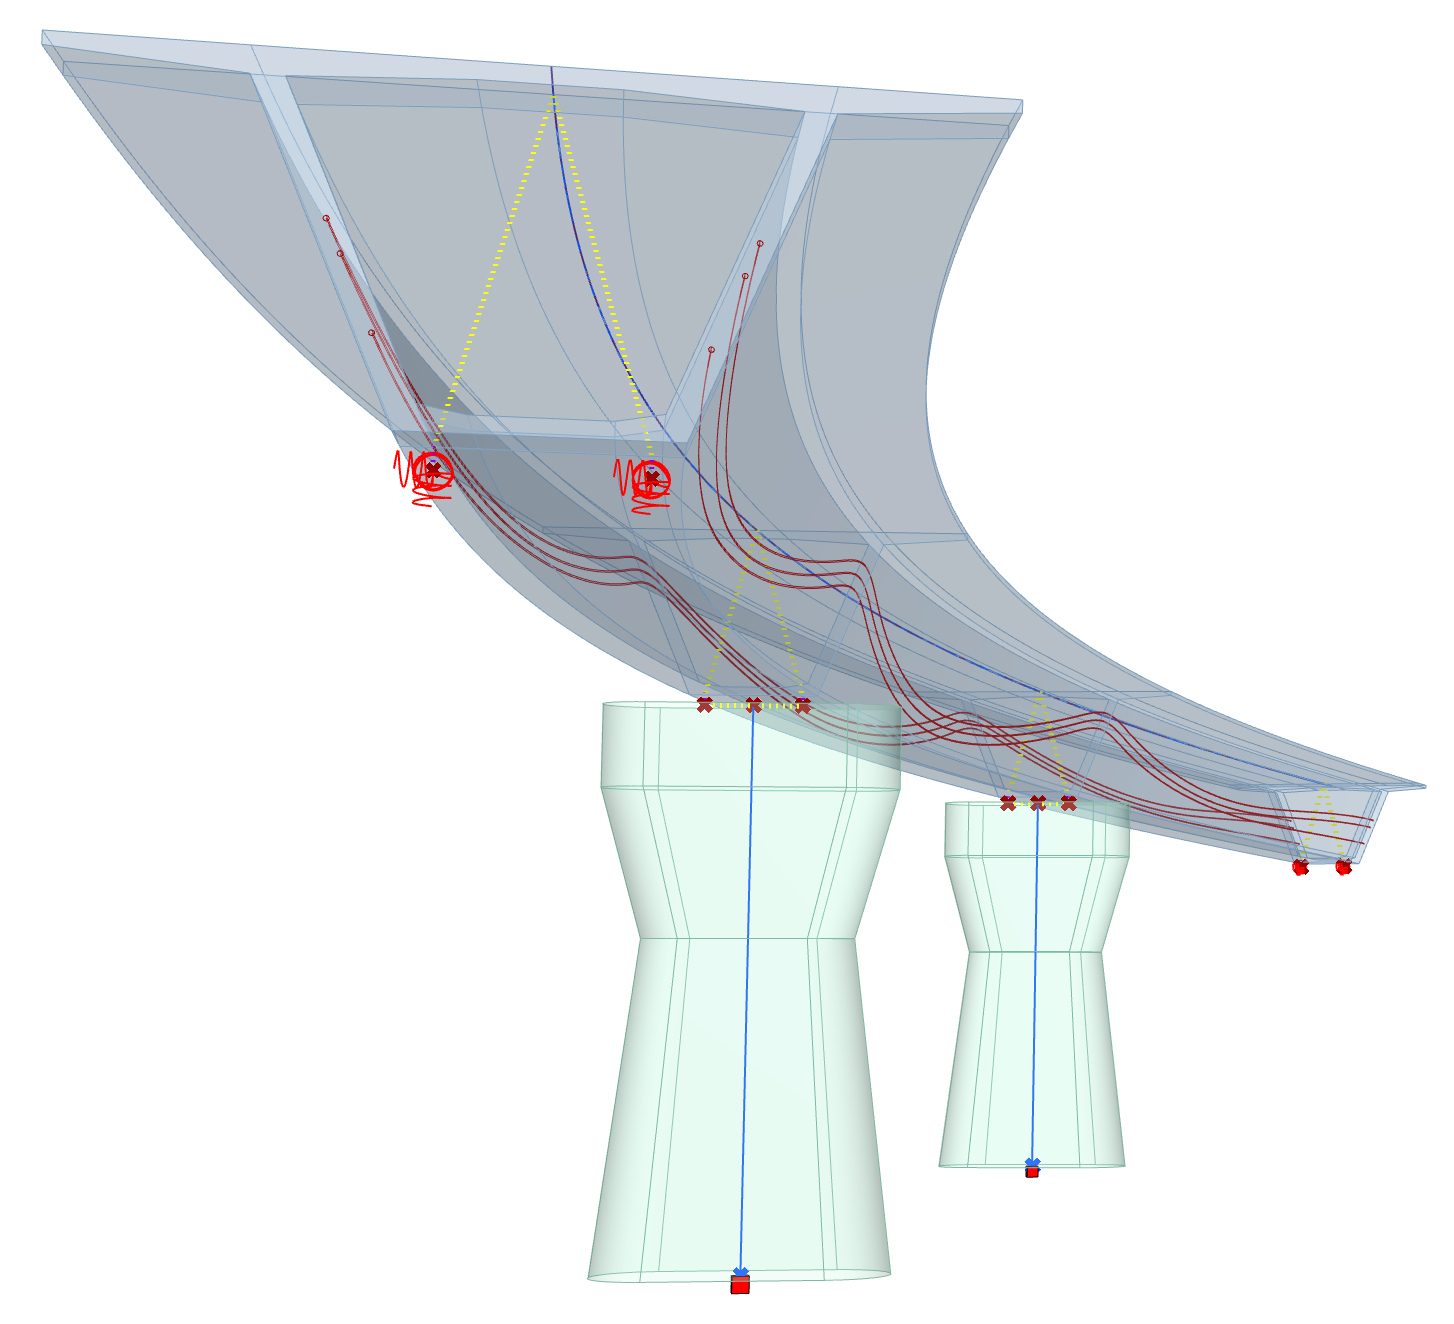
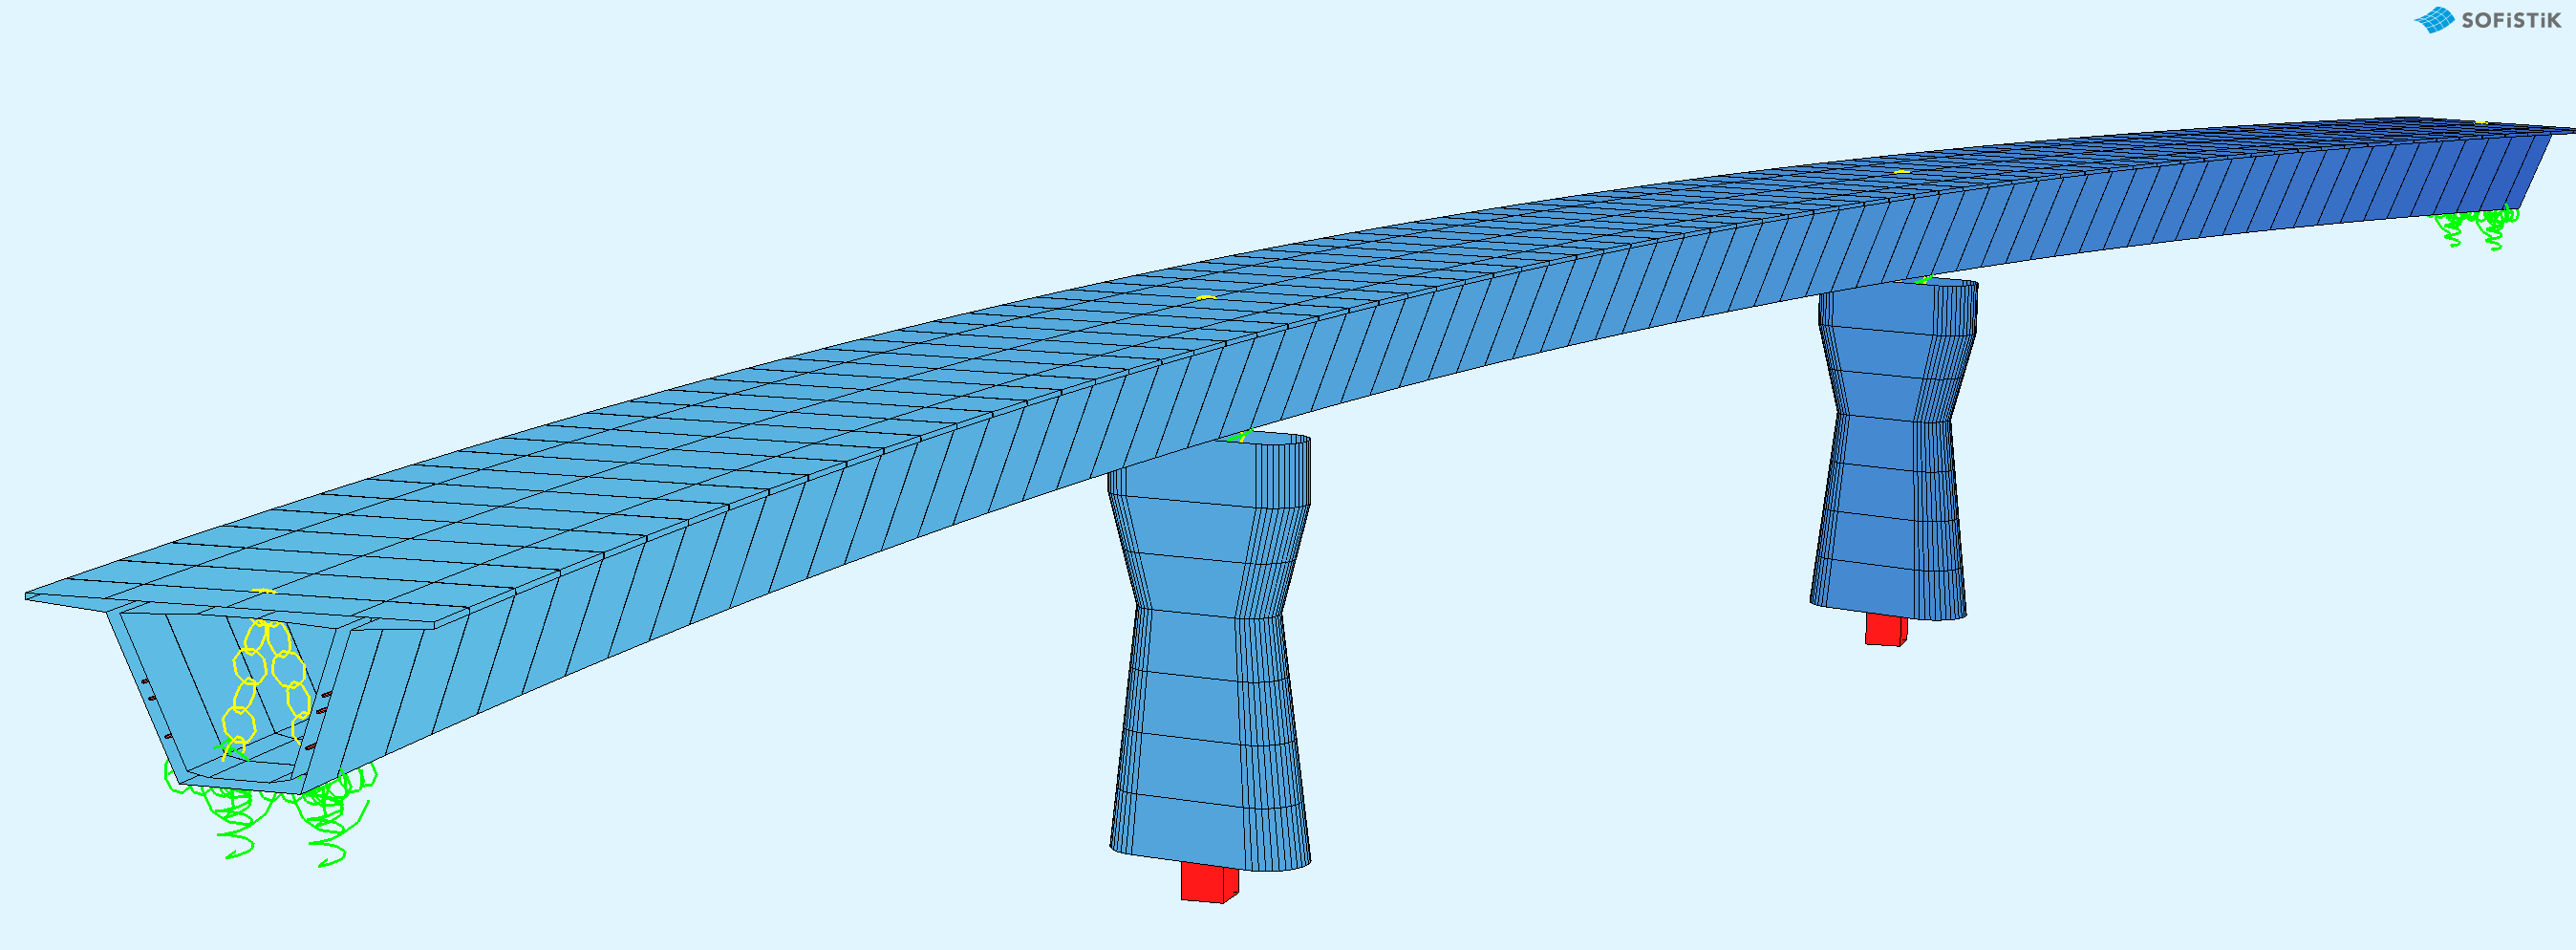
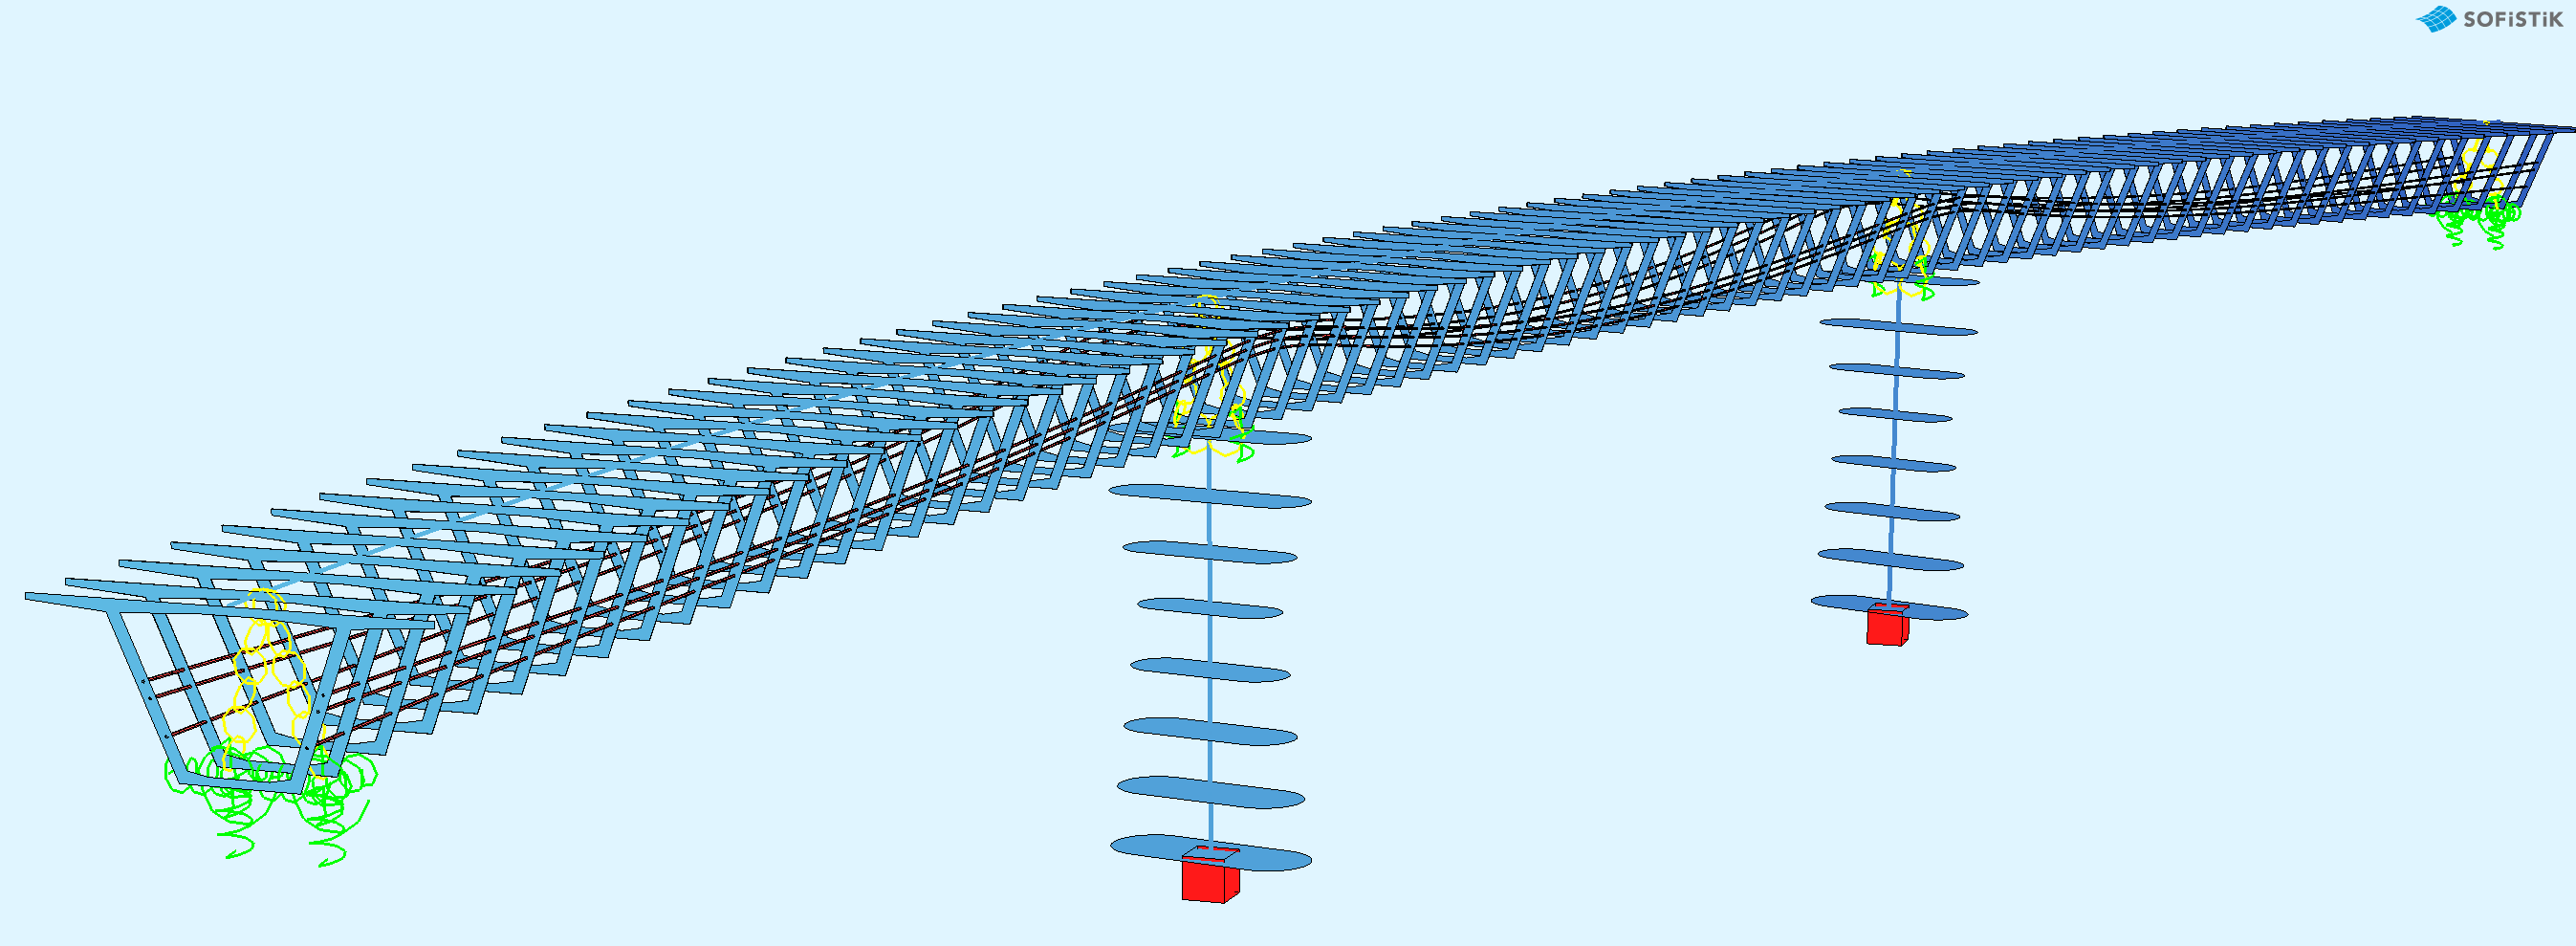
Figure 2. Geometric and Analytical Bridge Models
Define the Bridge Alignment
In this project, the bridge axis has been defined based on horizontal and vertical alignment data using components PlanViewSegment, ElevationViewPoint and PlanViewAxis.
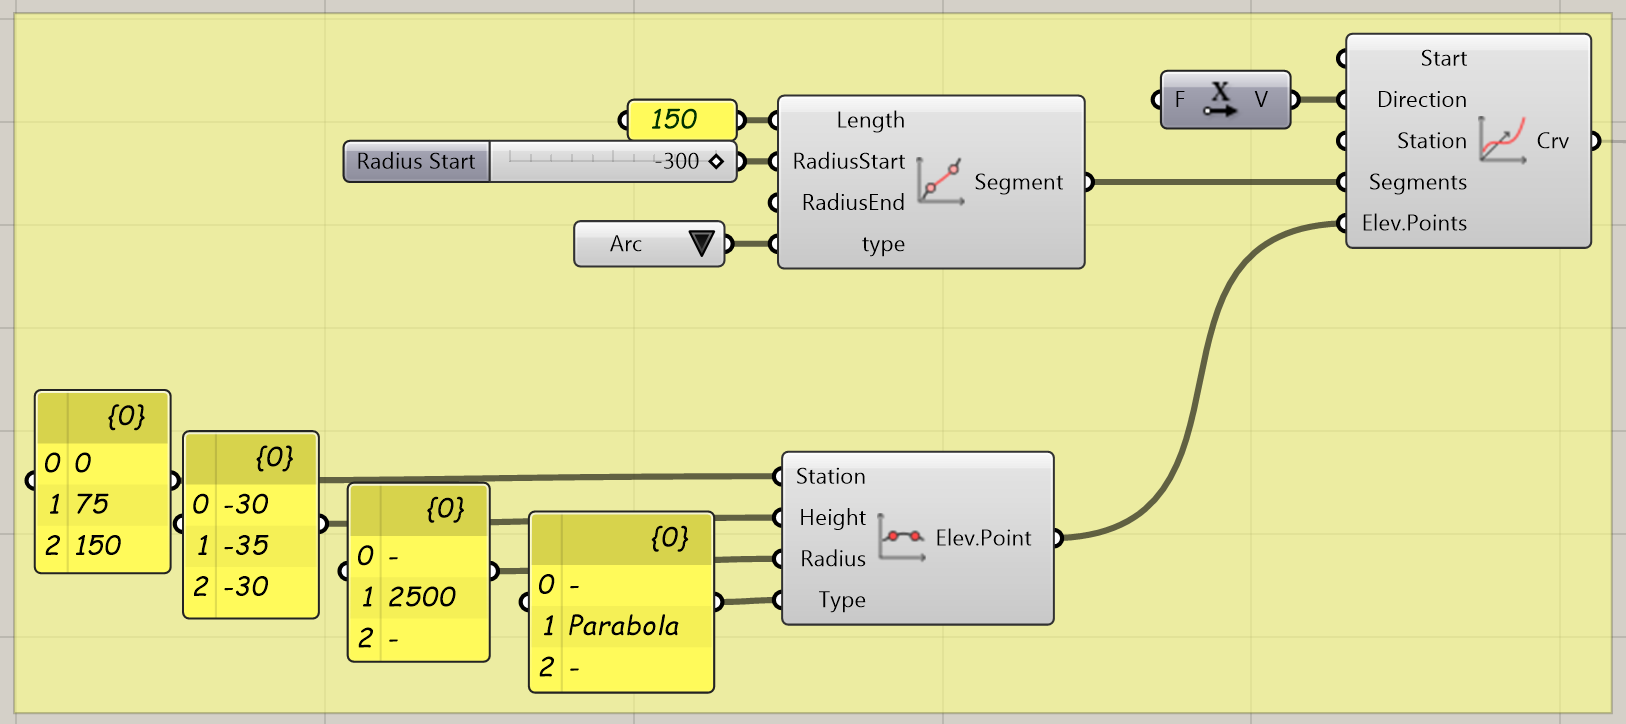
Figure 3. GH Script: Bridge Axis
Define the Superstructure Cross Section
Cross sections can be used for both the geometric and the analytical models. As shown in Figure 4., there are different ways to define cross sections. For example, they can be imported from a SOFiSTiK database with the ReadSectionCdb component or they can be imported from a library of predefined sections using the ReadSectionLibrary component. You can also create an arbitrary section by simply drawing it in Rhino using the SectionFromBrep component.
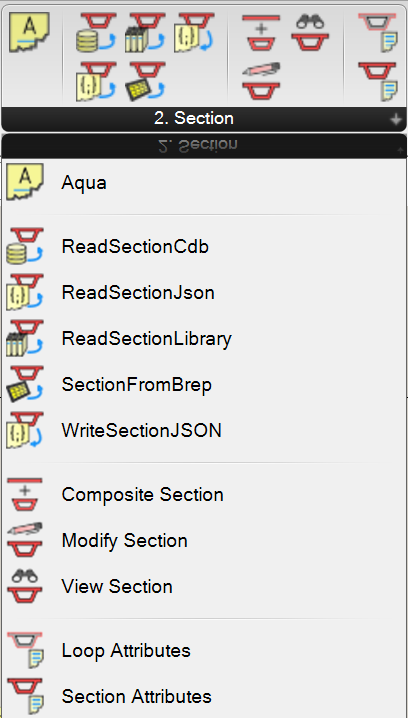
Figure 4. gh_sofistik Section Components
Reading a Section from a JSON File
The parametric box girder section used in this example has beed defined using the JSON file format (Section Definition In Json Format). The file called “Single-Cell Box Girder [mm].json” is included in the project files. Bring it into the project by using the ReadSectionJSON component.
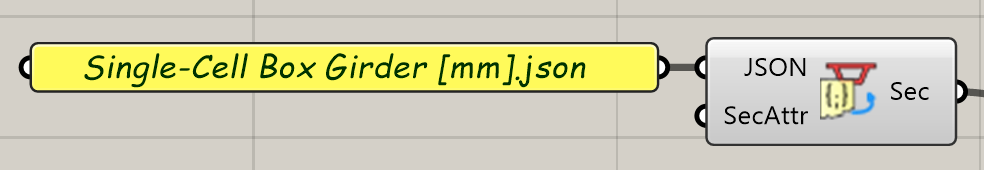
Figure 5. GH Script: Cross Section Definition
Use the Modify Section component to change any of the cross section dimensions. The Section Attributes component adds important cross section properties needed for the analytical model, like the section id, section name, and material number. The section can be visualized in Rhino using View Section.
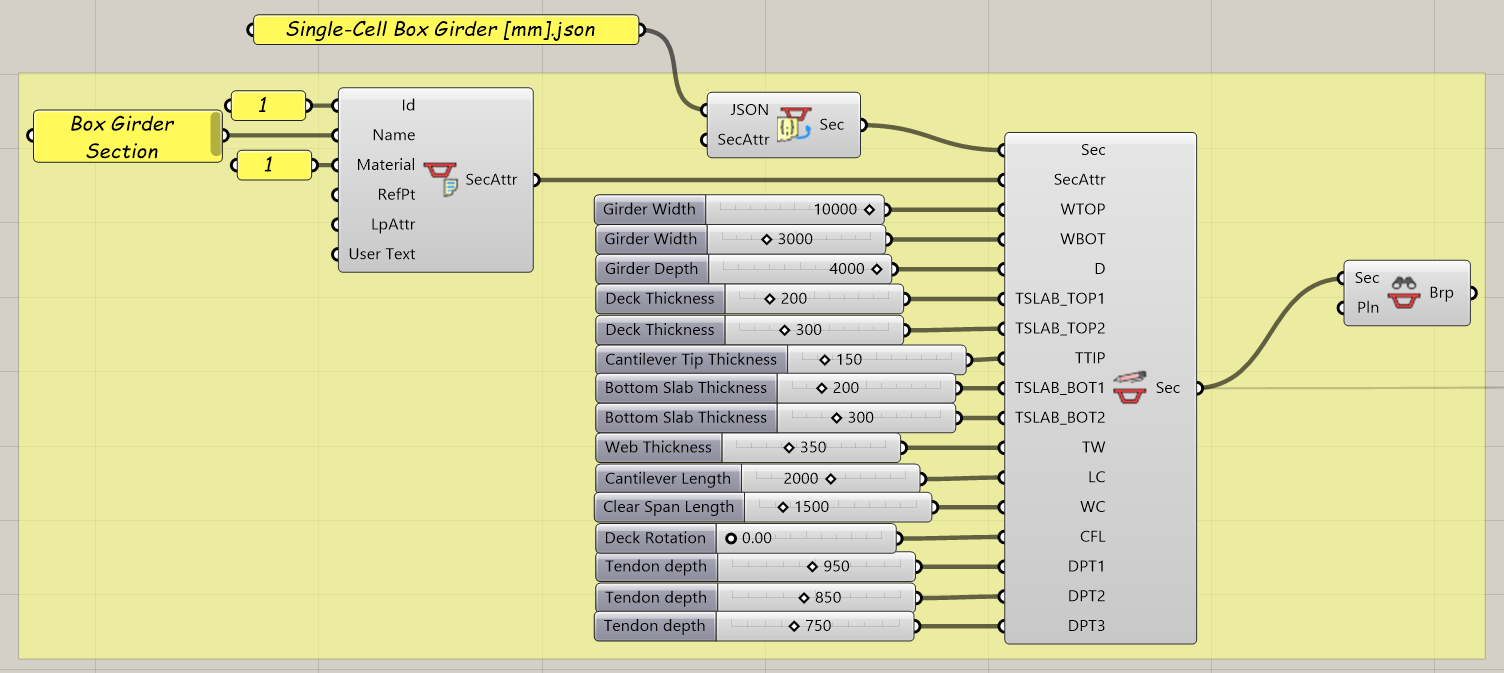
Figure 6. GH Script: Cross Section
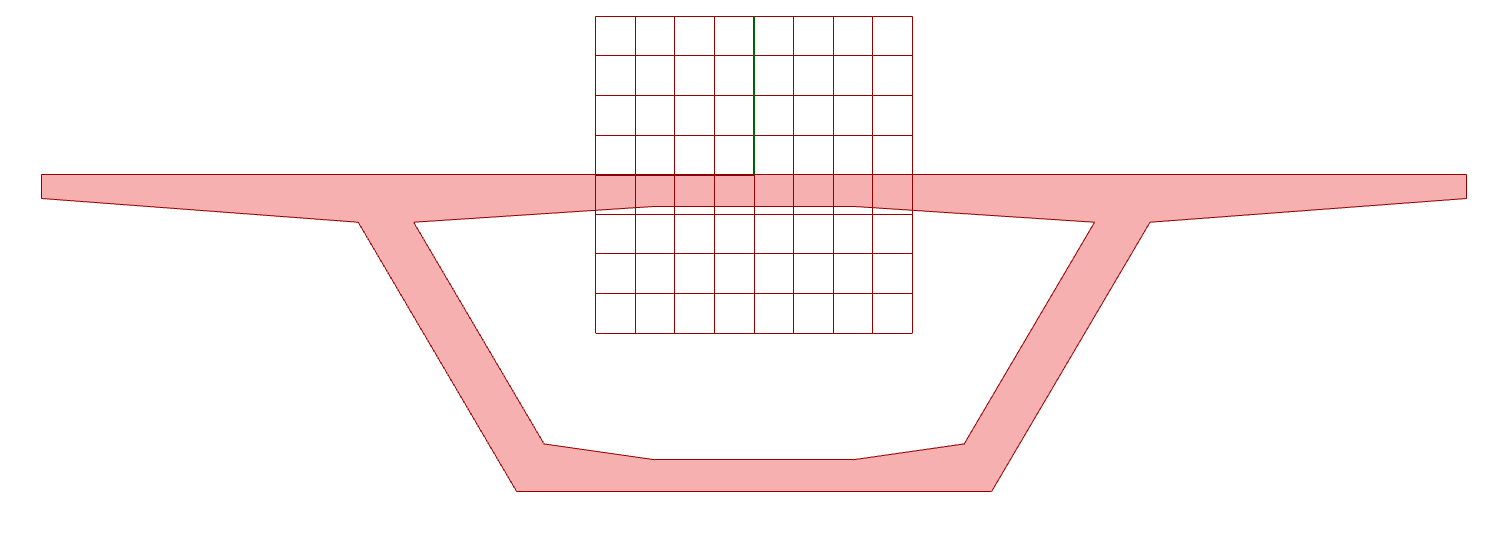
Figure 7. Cross Section Visualization in Rhino
Axis Placements
The Axis Placement component defines important planes or stations along the bridge alignment. In SOFiSTiK, these stations are called “Placements”. Placements of Type “S” indicate the location of supports. This information is used by the program to define the span-layout of the bridge.
Note: Later in the workflow, other SOFiSTiK components will require the input of “stations”. They can be provided as numerical station values, station names or span-stations. In the next chapter, tendon offset values are defined at certain span-stations. As an example, a station at 40% of span 1 can be refered using a span-station value of 1.4.
Placements can be rotated around the bridge alignment’s local x-axis, resulting in a rotation of the superstructure or superelevation. Similarly, placements can be rotated around the alignment’s local z-axis, resulting in a skew. If the alignment has a vertical inclination, users can specify whether placements should remain vertical or perpendicual to the bridge axis.
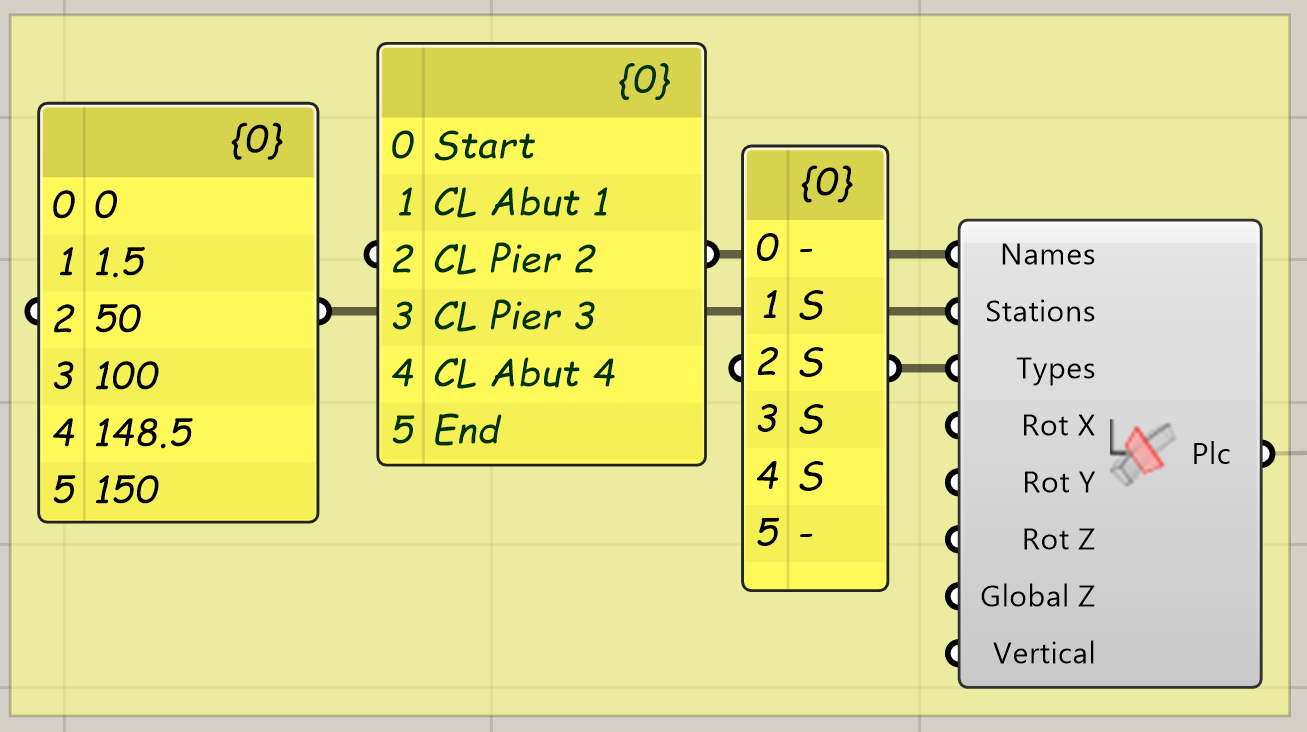
Figure 8. GH Script: Axis Placements
Axis Variables
Axis variables are cross section parameters that change along the bridge axis, for example the superstructure depth. Using the Axis Variable Distribution by Points component, it’s possible to refer to a cross section parameter, and assign values to it at given stations. The transition at any given point can be polygonal (linear interpolation) or smooth (spline).
Station Types
By default, station values will be interpolated linearly. The following station types are available:
“#”: linear interpolation of variable at this station
“-“: a spline with a slope according to corresponding tangent is applied left of specified station
“+”: a spline with a slope according to corresponding tangent is applied right of specified station
“*”: a spline with a slope according to corresponding tangent is applied on both sides of specified station
“/”: a spline is applied which runs through the value at specified station and whose tangent is calculated automatically
Tendons can be defined using this method. Cross section variables dpt1, dpt2 and dpt3 represent the vertical distance from the bottom slab to the center of gravity of the tendon ducts located in the webs. The points T1 to T6 are constrained to move along the inclined web center-lines.
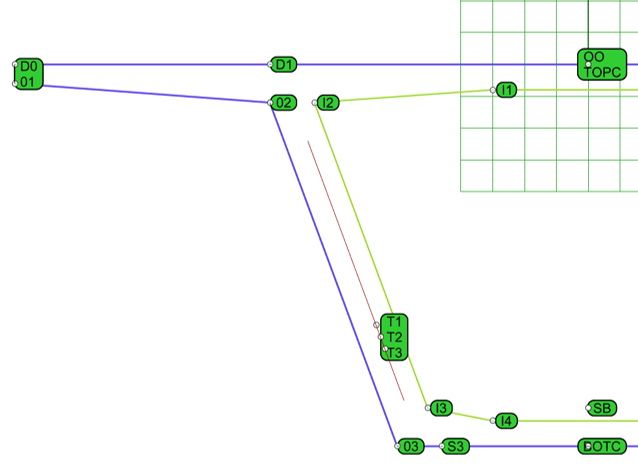
Figure 9. Cross Section Points
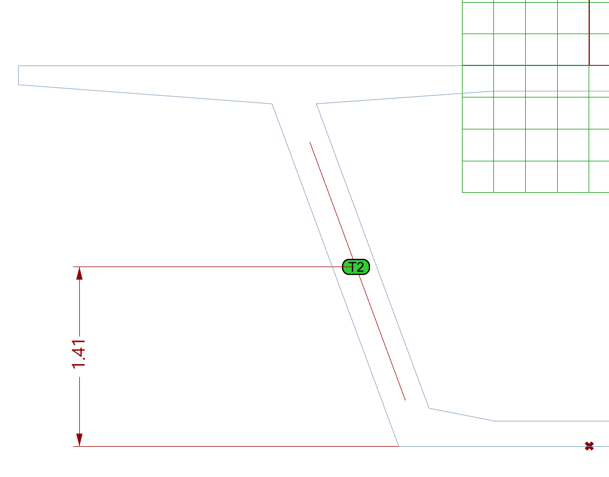
Figure 10. Axis Variable dpt2
In this example, offsets and station values are defined using a spreadsheet. The spreadsheet is included in the project files. The Read Spreadsheet component is used to read in values for dpt1, dpt2 and dpt3 at specific span-stations. Right click on the Read Spreadsheet component, and select “combine output with same name”. The component will organize each group of values in a separate tree branch.
Note that the values provided in the spreadsheet are being multiplied with the cross section depth. If the cross section depth changes, so will the tendons.
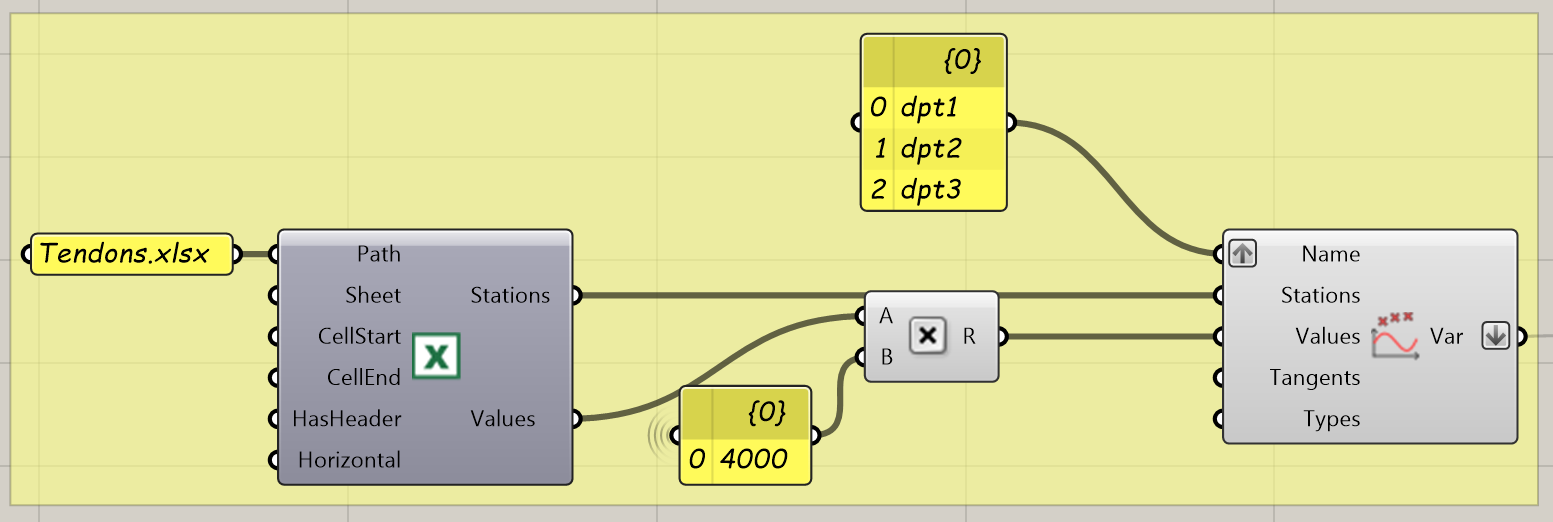
Figure 11. GH Script: Axis Variables
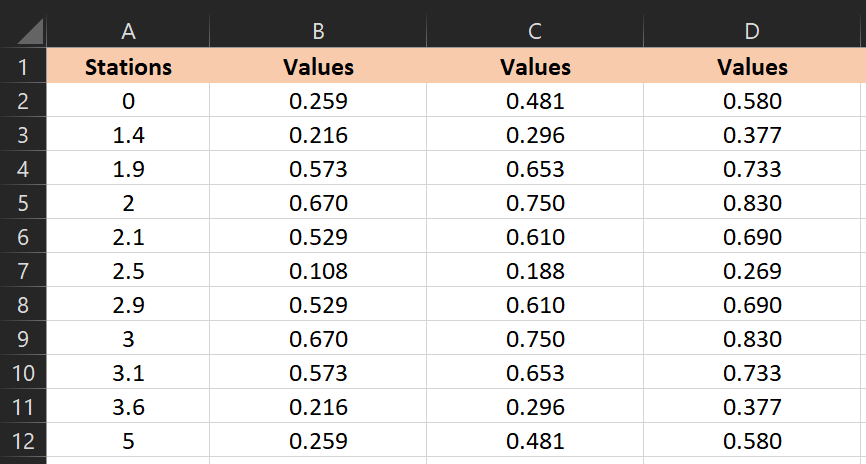
Figure 12. Input data using a Spreadsheet
The Axis Variable Distribution component will show a diagram of the defined variable distrubutions.
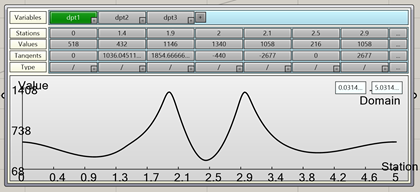
Figure 13. Axis Variable Distribution
Axis Definition
The Axis Definition component collects the road alignment, the placements, the bridge cross section and corresponding axis variables and builds the basis for the bridge geometric and analytical models. Clicking on the component will preview the placements in Rhino. The Interpolate Solid component creates a solid volume object of the bridge superstructure. By default, the solid is split at the placements. From a data structure perspective, every segment is stored in a separate tree branch. Right clicking on the Interpolate Solid component and pressing “Bake” will bring the 3d objects of the bridge superstructure into Rhino.
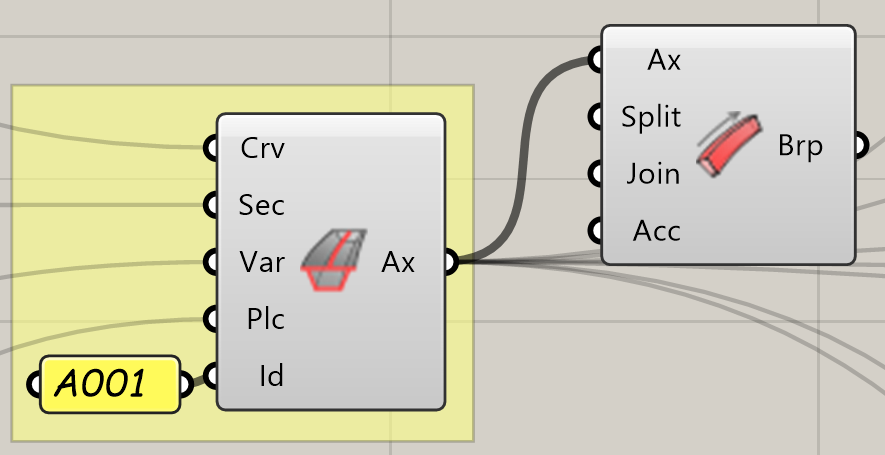
Figure 14. GH Script: Axis Definition and Superstructure Geometric Model
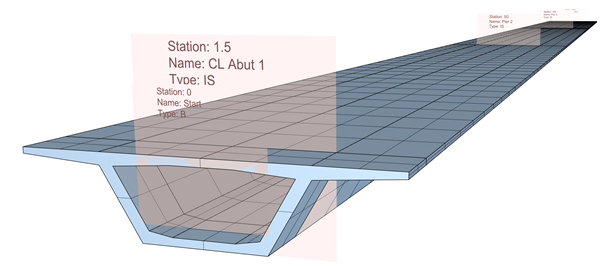
Figure 15. Baked Superstructure and Placements
Superstructure Analytical Model
The Interpolate Curve component uses cross section points to create curves along the bridge axis. The curves can be used to define the superstructure Structural Lines. The component organizes each curve segment in a separate tree branch.
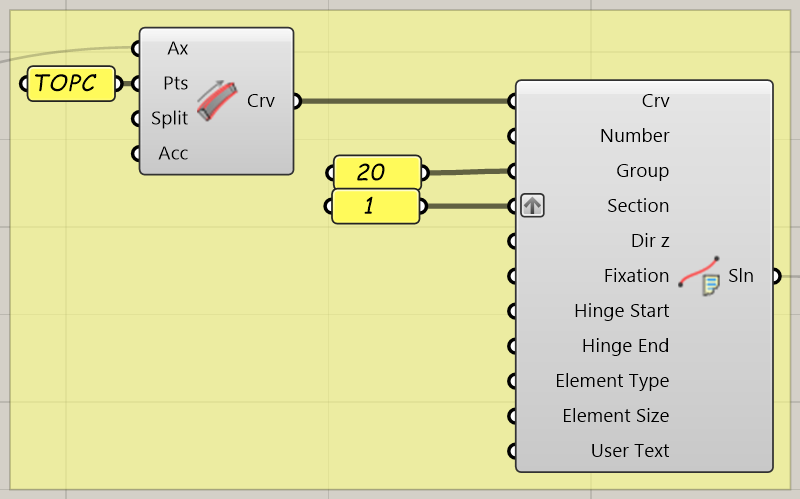
Figure 16. GH Script: Superstructure Structural Lines
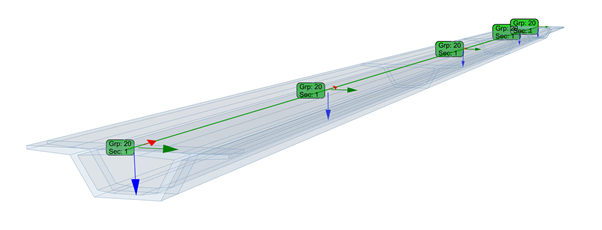
Figure 17. Preview of the Superstructure Analytical Lines and Structural Properties
Support Conditions
Support Conditions - Abutments
The Evaluate Section component is used to retrieve cross section points at a given station or list of stations. This can be used to define the superstructure´s analytical supports. In this example, the points S3 and S4 are connected to 3 sets of Springs, one for each local direction. Couplings are used to consider the eccentricity between the road axis and the bridge bearings.
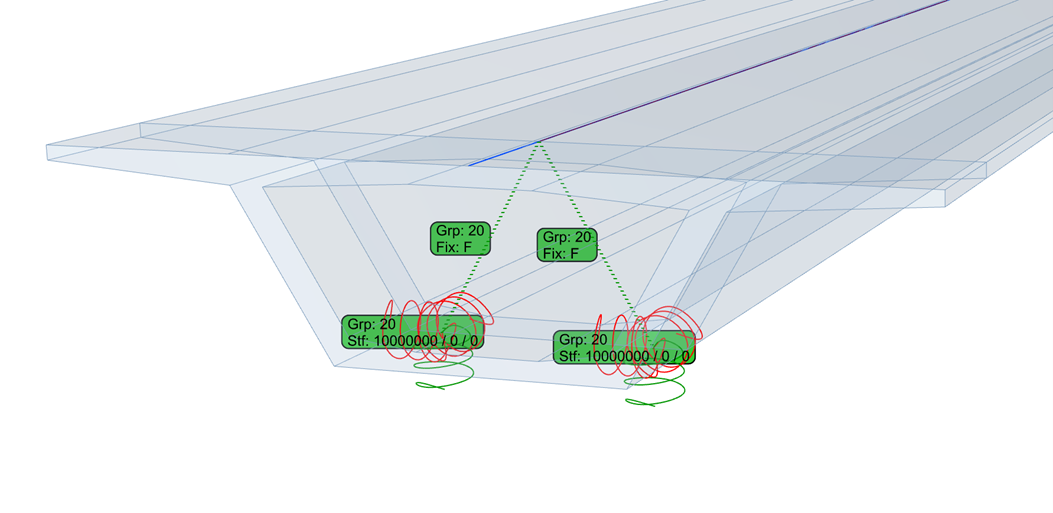
Figure 18. Preview of the Superstructure with Analytical Supports
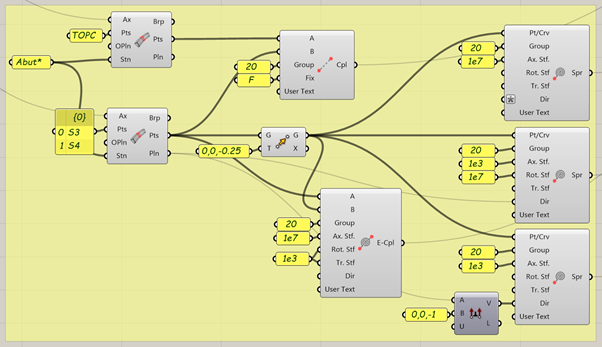
Figure 19. GH Script: Superstructure Support Conditions at Abutments
Support Conditions - Piers
At the pier location, the bridge superstructure sits on elastomeric bearing pads. These are defined using Elastic Couplings. The bottom of the bearing pads is connected to the top of the piers using rigid couplings.
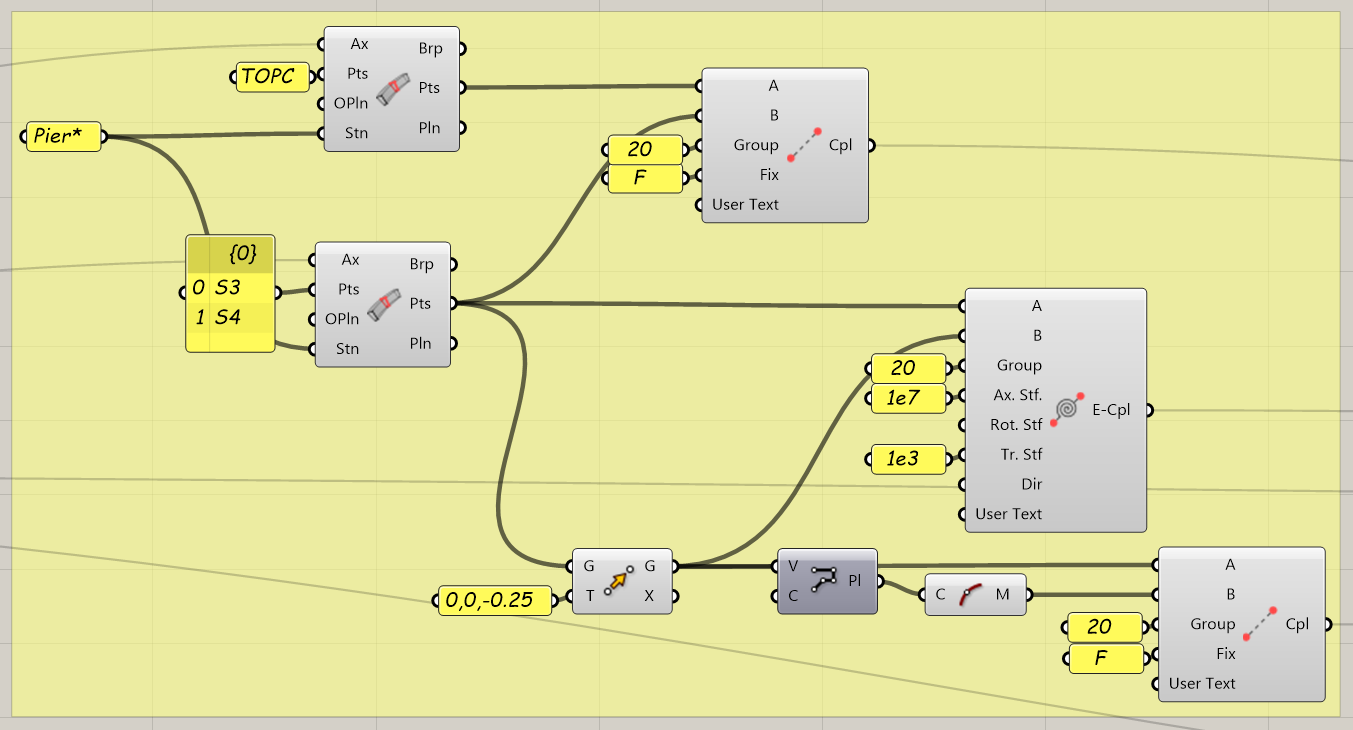
Figure 20. GH Script: Superstructure Support Conditions
Analytical Model - Piers
In this project, piers with a varying cross section are used. In this case, instead of defining an axis and axis variables, three rectangular cross sections with rounded edges are needed. The parametric rectangular section used in this project is included in the project files.
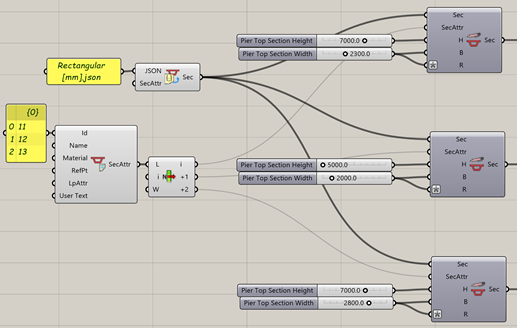
Figure 21. GH Script: Pier Cross Sections
Use the View Section component to place the sections in x-y planes. Use origin points with different z-values. Use the Area component to get the center of gravity of the sections. Use a Polyline component to connect the sections. The basis for the pier analytical model is now finished.
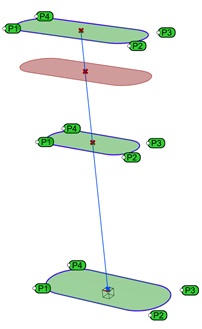
Figure 22. Pier Analytical Model
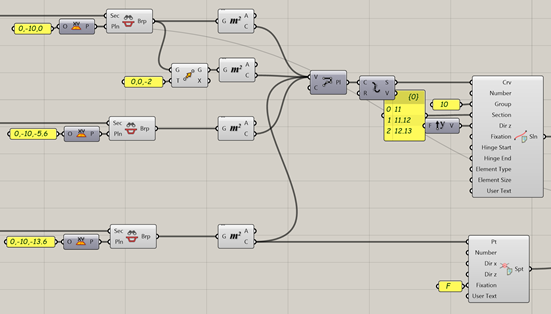
Figure 23. GH Script: Pier Analytical Model
Use the Placement Transform and Transform component to move the piers to their final positions.
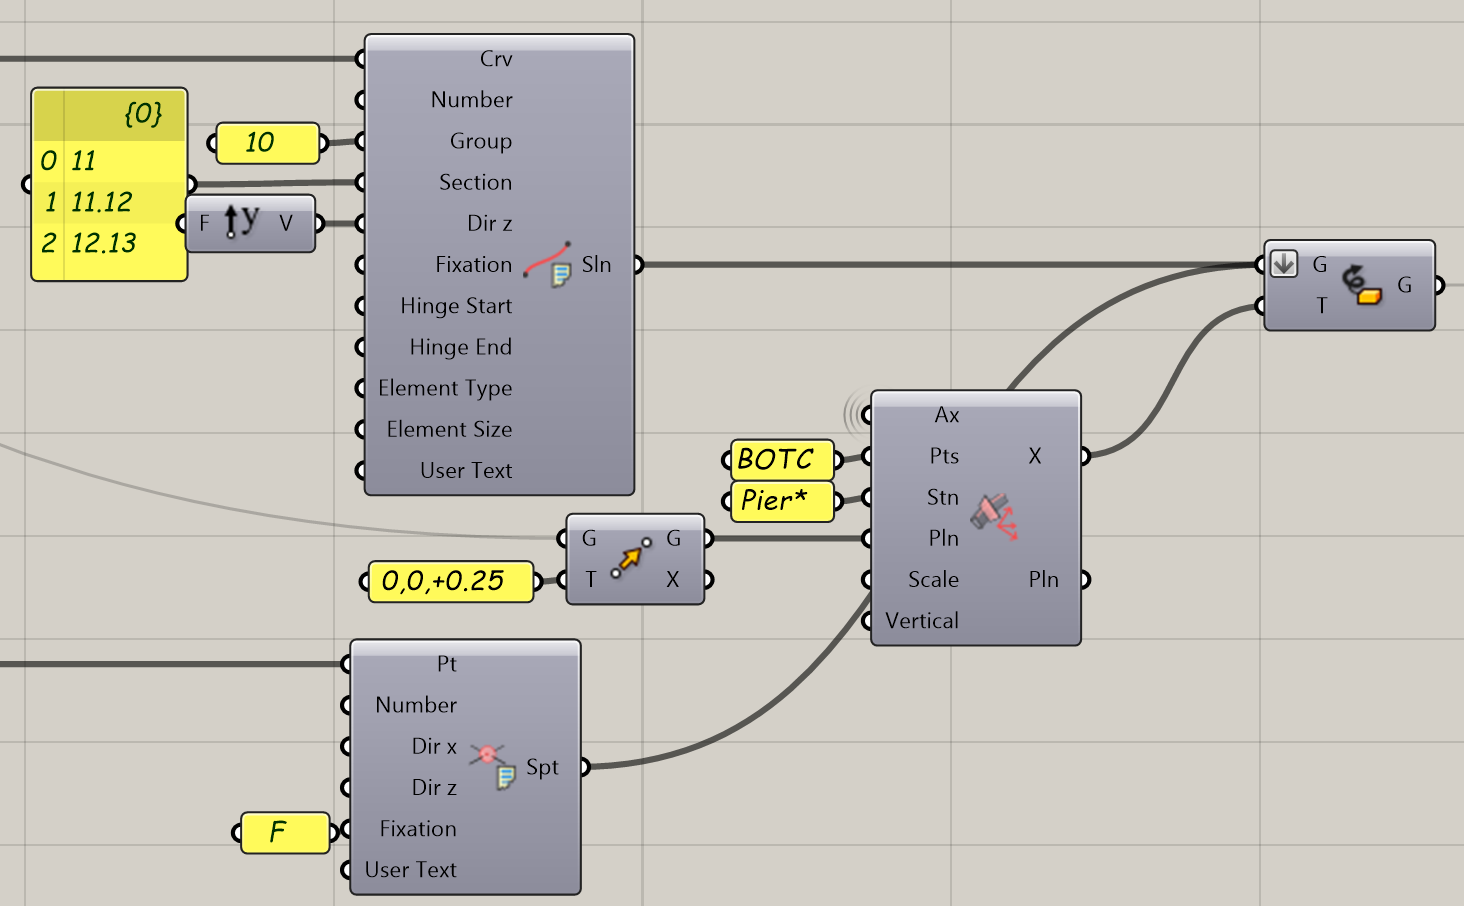
Figure 24. GH Script: Placement Transform
Tendon Definition
In this example, the tendon geometry is defined to follow the varying cross section points T1 to T6. This is done with the Tendon Geometry component. Load-case numbers are added using the Tendon component. Construction stage numbers for tendon stressing and grouting as well as the number of tendons are provided with the Tendon Attributes component.
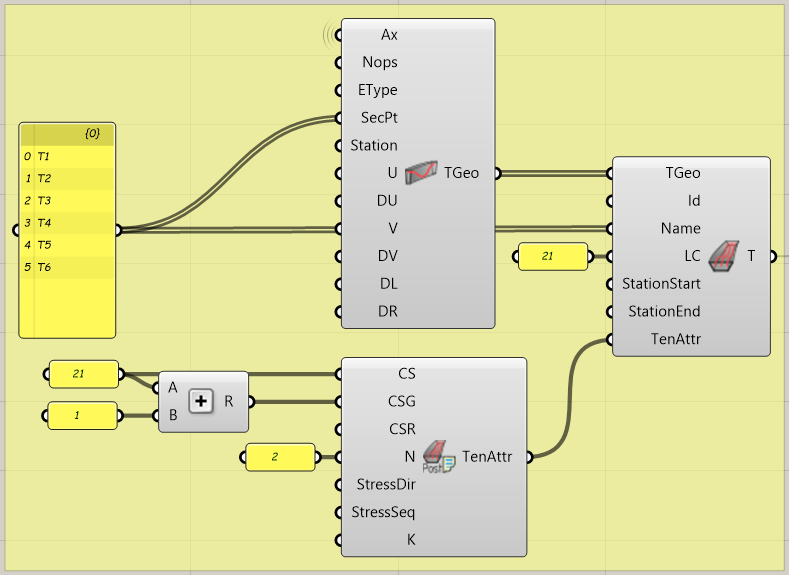
Figure 25. GH Script: Superstructure Tendons
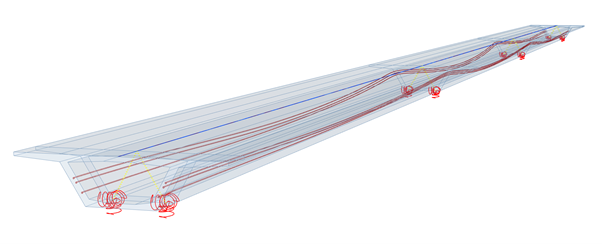
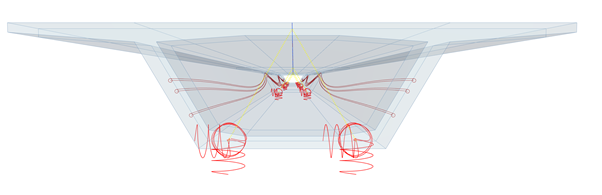
Figure 26. Preview of the Tendons
Generating a SOFiSTiK Model
Cross Sections
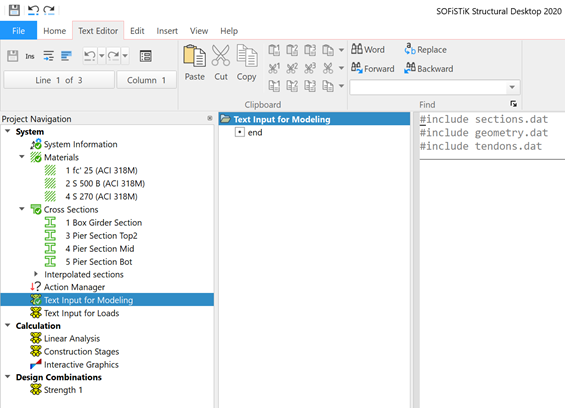
Use the AQUA component to automatically generate the CadInp code needed to run cross sections in SOFiSTiK. Use the Text File component to stream the generated data into your project folder. Save the file as “sections.dat”.
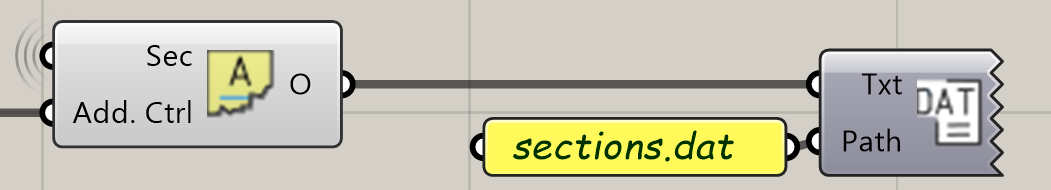
Figure 27. GH Script: Data for SOFiSTiK - Cross Sections
Structural Elements
Use the SOFiMSHC component to automatically generate the code needed to run the structural model and create a finite element model in SOFiSTiK. Note that the bridge axis is needed to interpolate the varying cross sections. Use the Text File component to stream the generated data into your project folder. Save the file as “geometry.dat”.
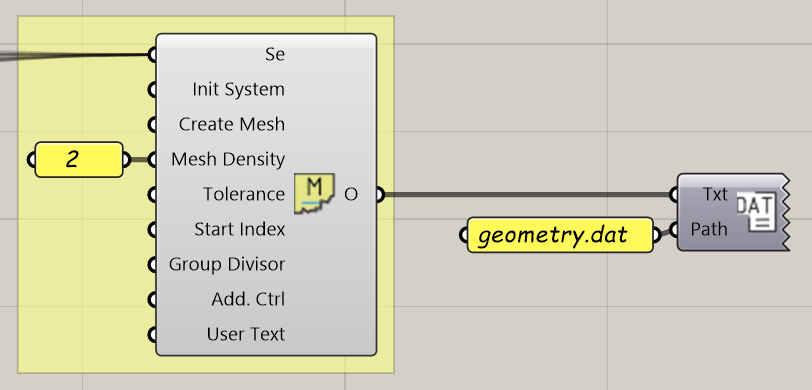
Figure 28. GH Script: Data for SOFiSTiK - Structural Elements
Tendons
Use the TENDON component to automatically generate the code needed to run the tendons. Use the Text File component to stream the generated data into your project folder. Save the file as “tendons.dat”. Define a prestressing system using the Prestressing System component.
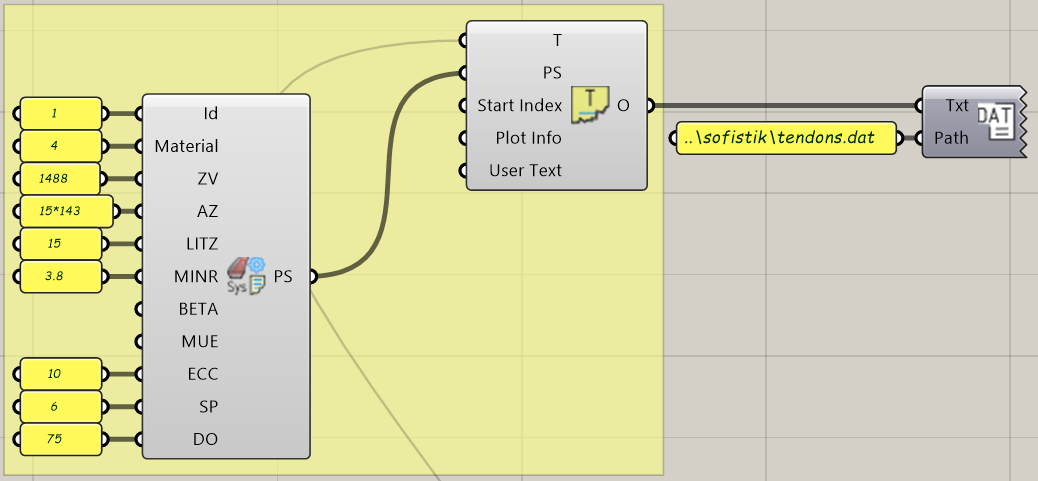
Figure 29. GH Script: Data for SOFiSTiK - Tendons